UiPath IPO Presentation Deck
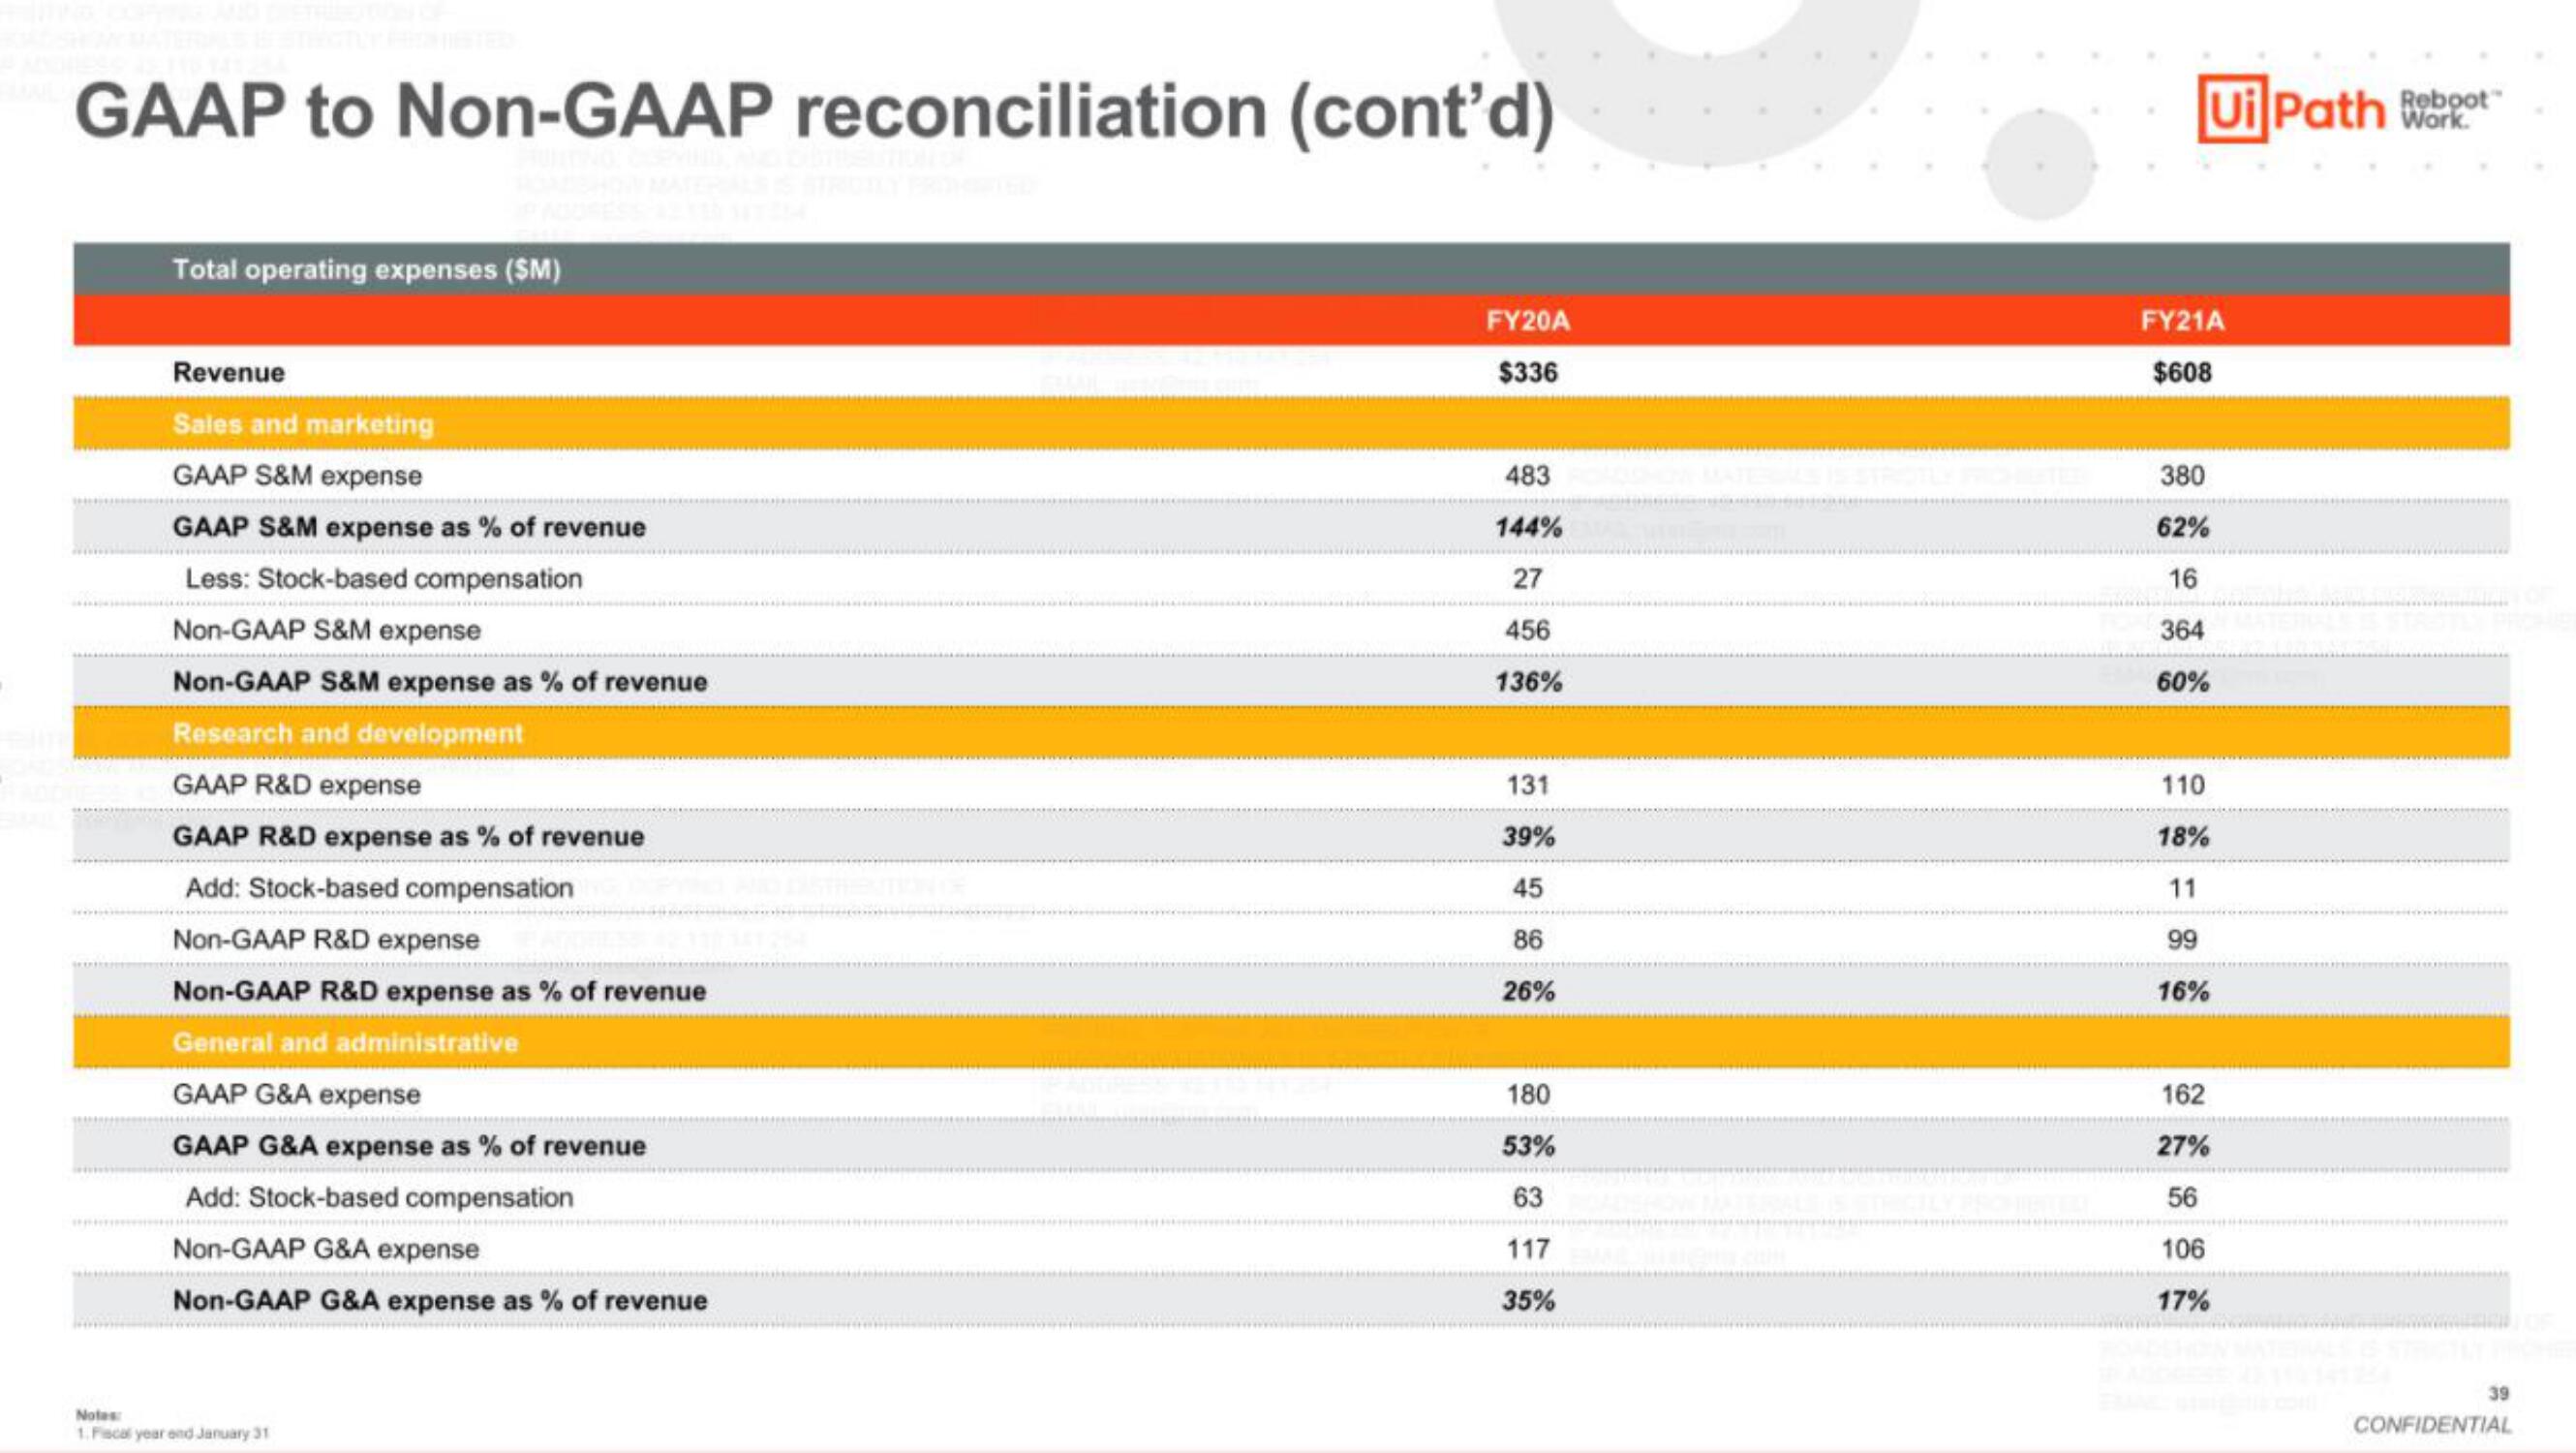
GAAP to Non-GAAP reconciliation (cont'd)
Total operating expenses ($M)
Revenue
Sales and marketing
GAAP S&M expense
GAAP S&M expense as % of revenue
Less: Stock-based compensation
Non-GAAP S&M expense
Non-GAAP S&M expense as % of revenue
Research and development
GAAP R&D expense
GAAP R&D expense as % of revenue
Add: Stock-based compensation
Non-GAAP R&D expense
Non-GAAP R&D expense as % of revenue
General and administrative
GAAP G&A expense
GAAP G&A expense as % of revenue
Add: Stock-based compensation
Non-GAAP G&A expense
Non-GAAP G&A expense as % of revenue
Notes:
1. Fiscal year and January 31
FY20A
$336
483
144%
27
456
136%
131
39%
45
86
26%
180
53%
63
117
35%
FY21A
$608
380
62%
16
364
60%
Ui Path Work
110
18%
11
99
16%
162
27%
56
106
17%
39
CONFIDENTIALView entire presentation