Roblox Results Presentation Deck
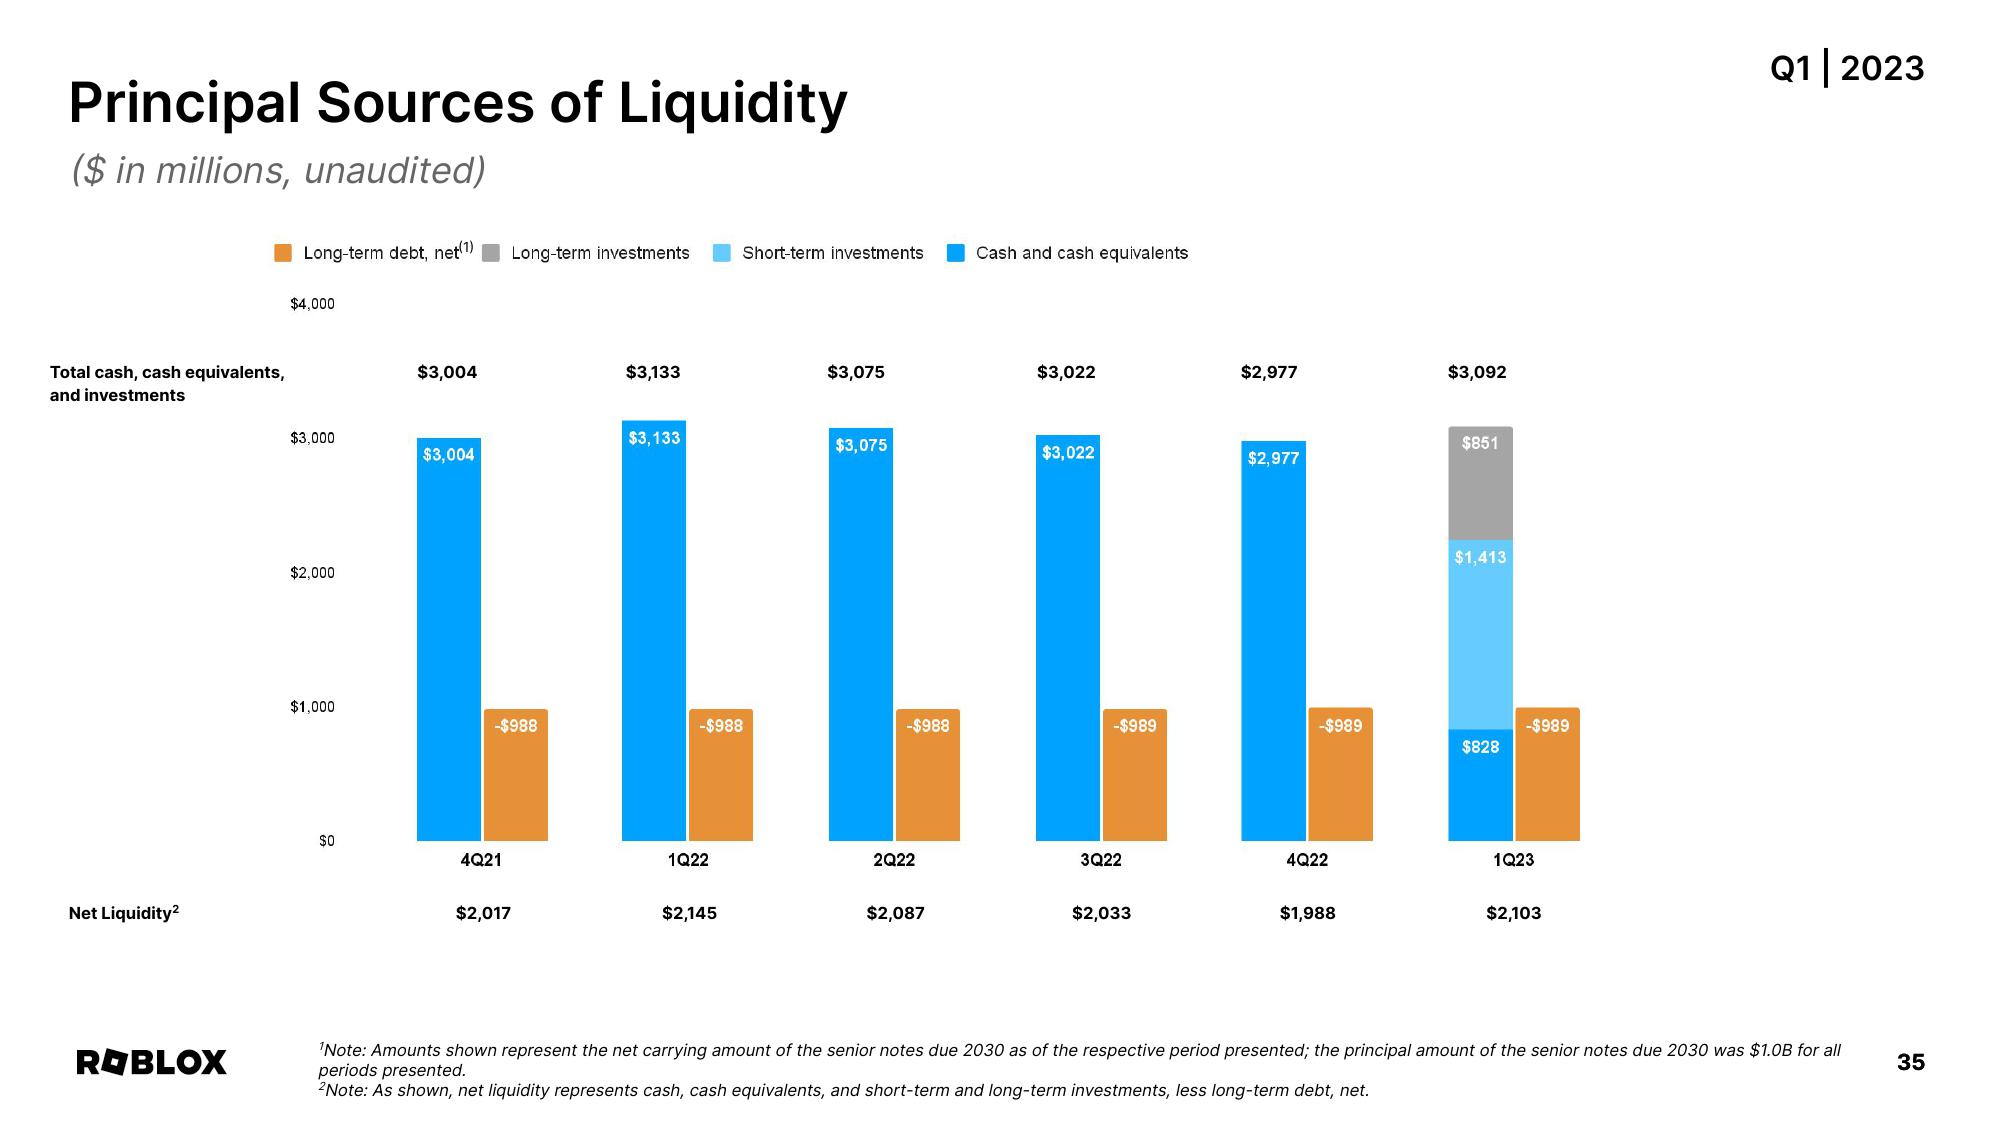
Principal Sources of Liquidity
($ in millions, unaudited)
Total cash, cash equivalents,
and investments
Net Liquidity²
ROBLOX
Long-term debt, net(1) Long-term investments
$4,000
$3,000
$2,000
$1,000
$0
$3,004
$3,004
-$988
4Q21
$3,133
$2,017
$3,133
$3,075
$3,022
LLLLLL
-$988
-$989
2Q22
Short-term investments
-$988
1Q22
$2,145
$3,075
Cash and cash equivalents
$2,087
$3,022
3Q22
$2,977
$2,033
$2,977
-$989
4Q22
$3,092
$1,988
$851
$1,413
$828
-$989
1Q23
$2,103
Q1 2023
¹Note: Amounts shown represent the net carrying amount of the senior notes due 2030 as of the respective period presented; the principal amount of the senior notes due 2030 was $1.0B for all
periods presented.
2Note: As shown, net liquidity represents cash, cash equivalents, and short-term and long-term investments, less long-term debt, net.
35View entire presentation