Bed Bath & Beyond Results Presentation Deck
APPENDIX
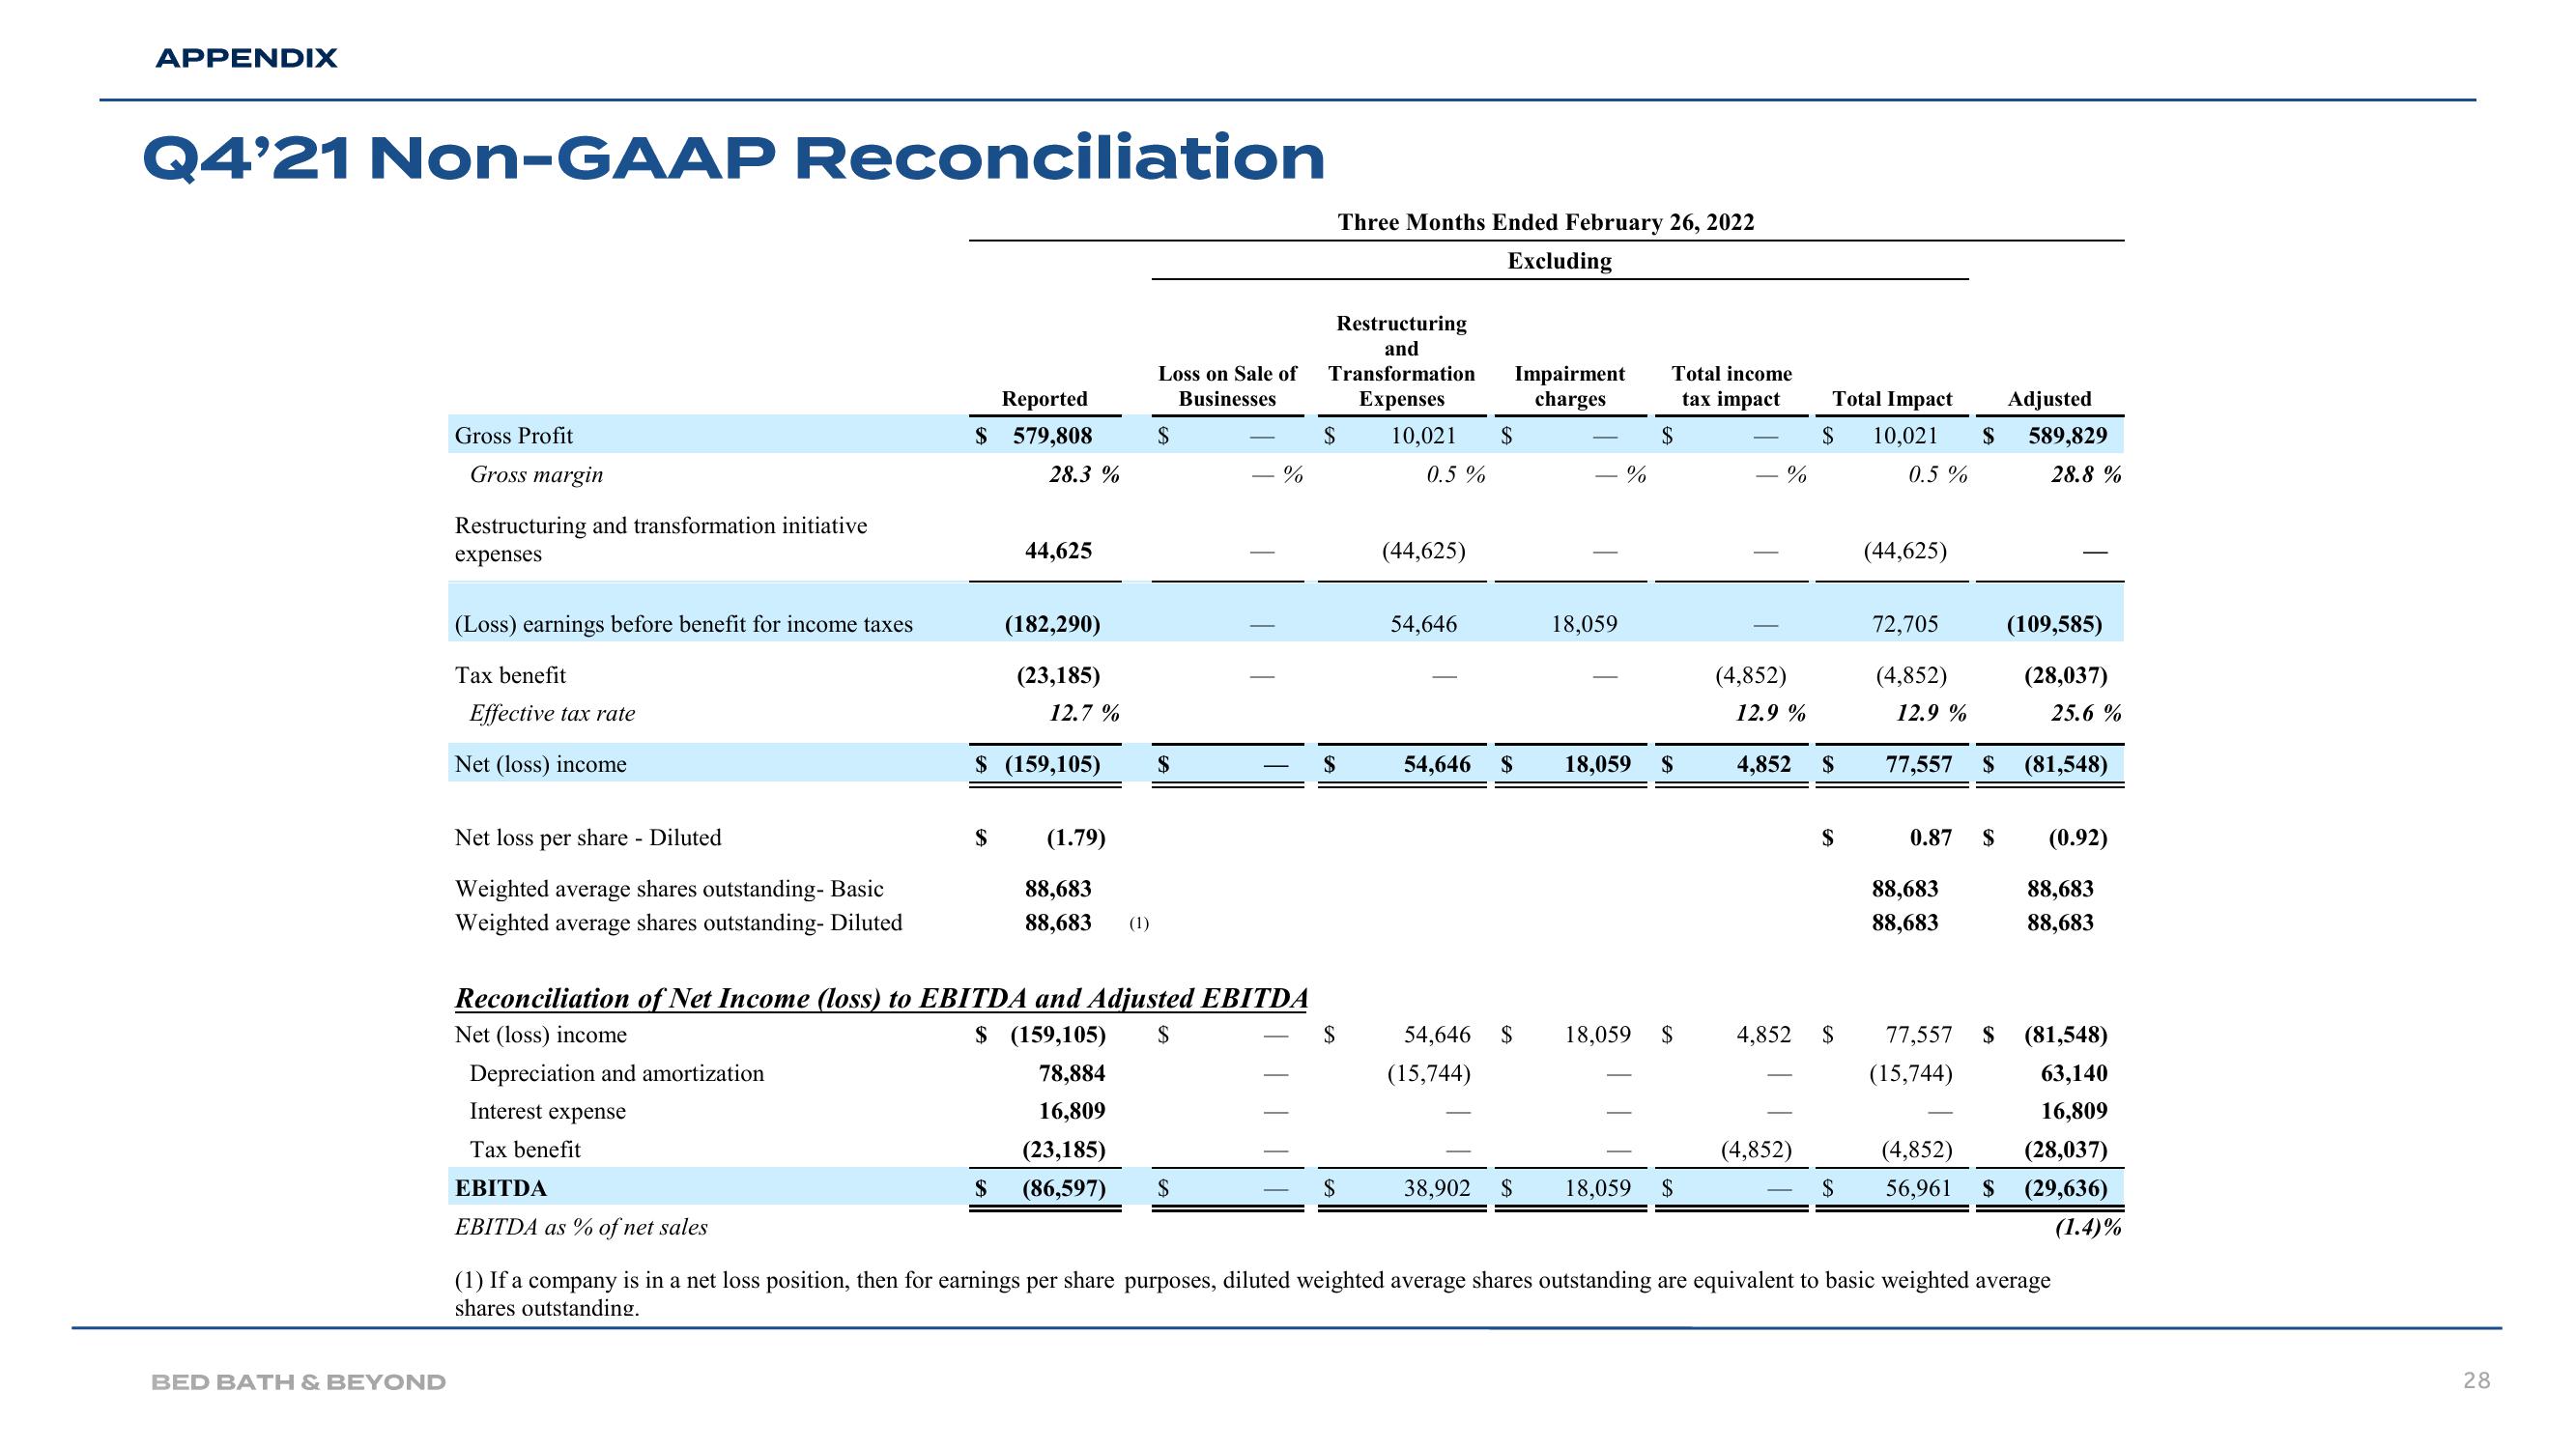
Q4'21 Non-GAAP Reconciliation
BED BATH & BEYOND
Gross Profit
Gross margin
Restructuring and transformation initiative
expenses
(Loss) earnings before benefit for income taxes
Tax benefit
Effective tax rate
Net (loss) income
Net loss per share - Diluted
Weighted average shares outstanding- Basic
Weighted average shares outstanding- Diluted
Reported
$ 579,808
EBITDA
EBITDA as % of net sales
$
28.3 %
44,625
$
(182,290)
(23,185)
$ (159,105)
12.7 %
(1.79)
88,683
88,683 (1)
Loss on Sale of
Businesses
$
$
Reconciliation of Net Income (loss) to EBITDA and Adjusted EBITDA
Net (loss) income
$ (159,105) $
Depreciation and amortization
78,884
Interest expense
16,809
Tax benefit
(23,185)
(86,597)
%
$
Restructuring
and
Transformation
Expenses
10,021 $
0.5%
$
Three Months Ended February 26, 2022
Excluding
$
$
$
(44,625)
54,646
Impairment
charges
54,646 $
54,646 $
(15,744)
- %
18,059
Total income
tax impact
$
18,059 $
18,059 $
38,902 $ 18,059 $
%
(4,852)
12.9%
Total Impact
$
4,852 $
(4,852)
$
4,852 $
Adjusted
10,021 $ 589,829
0.5%
28.8%
(44,625)
72,705
(4,852)
12.9 %
77,557 $
0.87 $
88,683
88,683
(109,585)
(28,037)
(4,852)
$ 56,961 $
25.6%
(81,548)
(0.92)
88,683
88,683
77,557 $ (81,548)
(15,744)
63,140
16,809
(28,037)
(29,636)
(1) If a company is in a net loss position, then for earnings per share purposes, diluted weighted average shares outstanding are equivalent to basic weighted average
shares outstanding.
(1.4)%
28View entire presentation