J.P.Morgan Results Presentation Deck
JPMORGAN CHASE & CO.
COMMERCIAL BANKING
FINANCIAL HIGHLIGHTS, CONTINUED
(in millions, except headcount and ratio data)
SELECTED BALANCE SHEET DATA (period-end)
Total assets
Loans:
Loans retained
Loans held-for-sale and loans at fair value
Total loans
Equity
Period-end loans by client segment
Middle Market Banking (a)
Corporate Client Banking
Commercial Real Estate Banking
Other
Total loans (a)
SELECTED BALANCE SHEET DATA (average)
Total assets
Loans:
Loans retained
Loans held-for-sale and loans at fair value
Total loans
Client deposits and other third-party liabilities
Equity
Average loans by client segment
Middle Market Banking
Corporate Client Banking
Commercial Real Estate Banking
Other
Total loans
Headcount
CREDIT DATA AND QUALITY STATISTICS
Net charge-offs/(recoveries)
Nonperforming assets
Nonaccrual loans:
Nonaccrual loans retained (b)(c)
Nonaccrual loans held-for-sale and loans
at fair value
Total nonaccrual loans
Assets acquired in loan satisfactions
Total nonperforming assets
Allowance for credit losses:
Allowance for loan losses
Allowance for lending-related commitments
Total allowance for credit losses
Net charge-off/(recovery) rate (d)
Allowance for loan losses to period-end loans retained
Allowance for loan losses to nonaccrual loans retained (b)
Nonaccrual loans to period-end total loans
$
$
$
$
$
$
3Q22
$
247,485
231,829
137
231,966
25,000
71,707
52,940
107,241
78
231,966
246,318
227,539
1,589
229,128
281,336
25,000
70,002
52,432
106,546
148
$ 229,128
14,299
42
836
836
7
843
3,050
864
3,914
0.07
1.32
365
0.36
%
$
$
$
$
$
$
$
2Q22
$
242,456
223,541
566
224,107
25,000
68,535
49,503
105,982
87
224,107
239,381
66,640
47,832
104,890
120
$ 219,482
13,811
218,478
1,004
219,482
300,425
25,000
1
761
761
8
769
2,602
725
3,327
1.16
342
0.34
%
$
$
$
$
$
$
1Q22
$
QUARTERLY TRENDS
235,127
$ 233,474
213,073
1,743
214,816
25,000
64,306
46,720
103,685
105
214,816
208,540
2,147
210,687
316,921
25,000
62,437
45,595
102,498
157
210,687
13,220
6
751
751
17
768
2,357
762
3,119
0.01 %
1.11
314
0.35
$
$
$
$
$
$
$
$
$
4Q21
230,776
206,220
2,223
208,443
24,000
61,159
45,315
101,751
218
208,443
227,308
201,676
3,958
205,634
323,821
24,000
59,784
44,976
100,682
192
205,634
12,902
8
740
740
17
757
2,219
749
2,968
0.02 %
1.08
300
0.36
$
$
$
$
$
$
$
$
$
3Q21
227,670
201,283
3,412
204,695
24,000
58,918
45,107
100,458
212
204,695
222,760
199,789
2,790
202,579
300,595
24,000
59,032
43,330
100,120
97
202,579
12,584
31
735
735
16
751
2,354
711
3,065
0.06
1.17
320
0.36
%
3Q22 Change
2Q22
2%
4
(76)
5
7
1
(10)
4
3
4
58
4
(6)
10
2
23
4
4
NM
10
10
(13)
10
17
19
18
JPMORGAN CHASE & Co.
NINE MONTHS ENDED SEPTEMBER 30,
3Q21
9%
15
(96)
13
4
22
17
7
(63)
13
11
14
(43)
13
(6)
4
19
21
6
53
13
14
35
14
14
(56)
12
30
22
28
$
$
$
$
$
$
$
2022
247,485
231,829
137
231,966
25,000
71,707
52,940
107,241
78
231,966
239,772
218,255
1,578
219,833
299,430
25,000
66,387
48,645
104,659
142
219,833
14,299
49
836
836
7
843
3,050
864
3,914
0.03%
1.32
365
0.36
$
$
201,283
3,412
$ 204,695
24,000
$
$
$
2021
$ 224,955
$
227,670
$
58,918
45,107
100,458
212
204,695
202,002
2,840
204,842
293,981
24,000
60,243
44,154
100,213
232
204,842
12,584
63
735
735
16
751
2,354
711
3,065
0.04 %
1.17
320
0.36
2022 Change
2021
9%
15
(96)
13
4
22
17
7
(63)
13
7
O
(44)
10
10
4
(39)
7
14
(22)
14
14
(56)
12
30
22
28
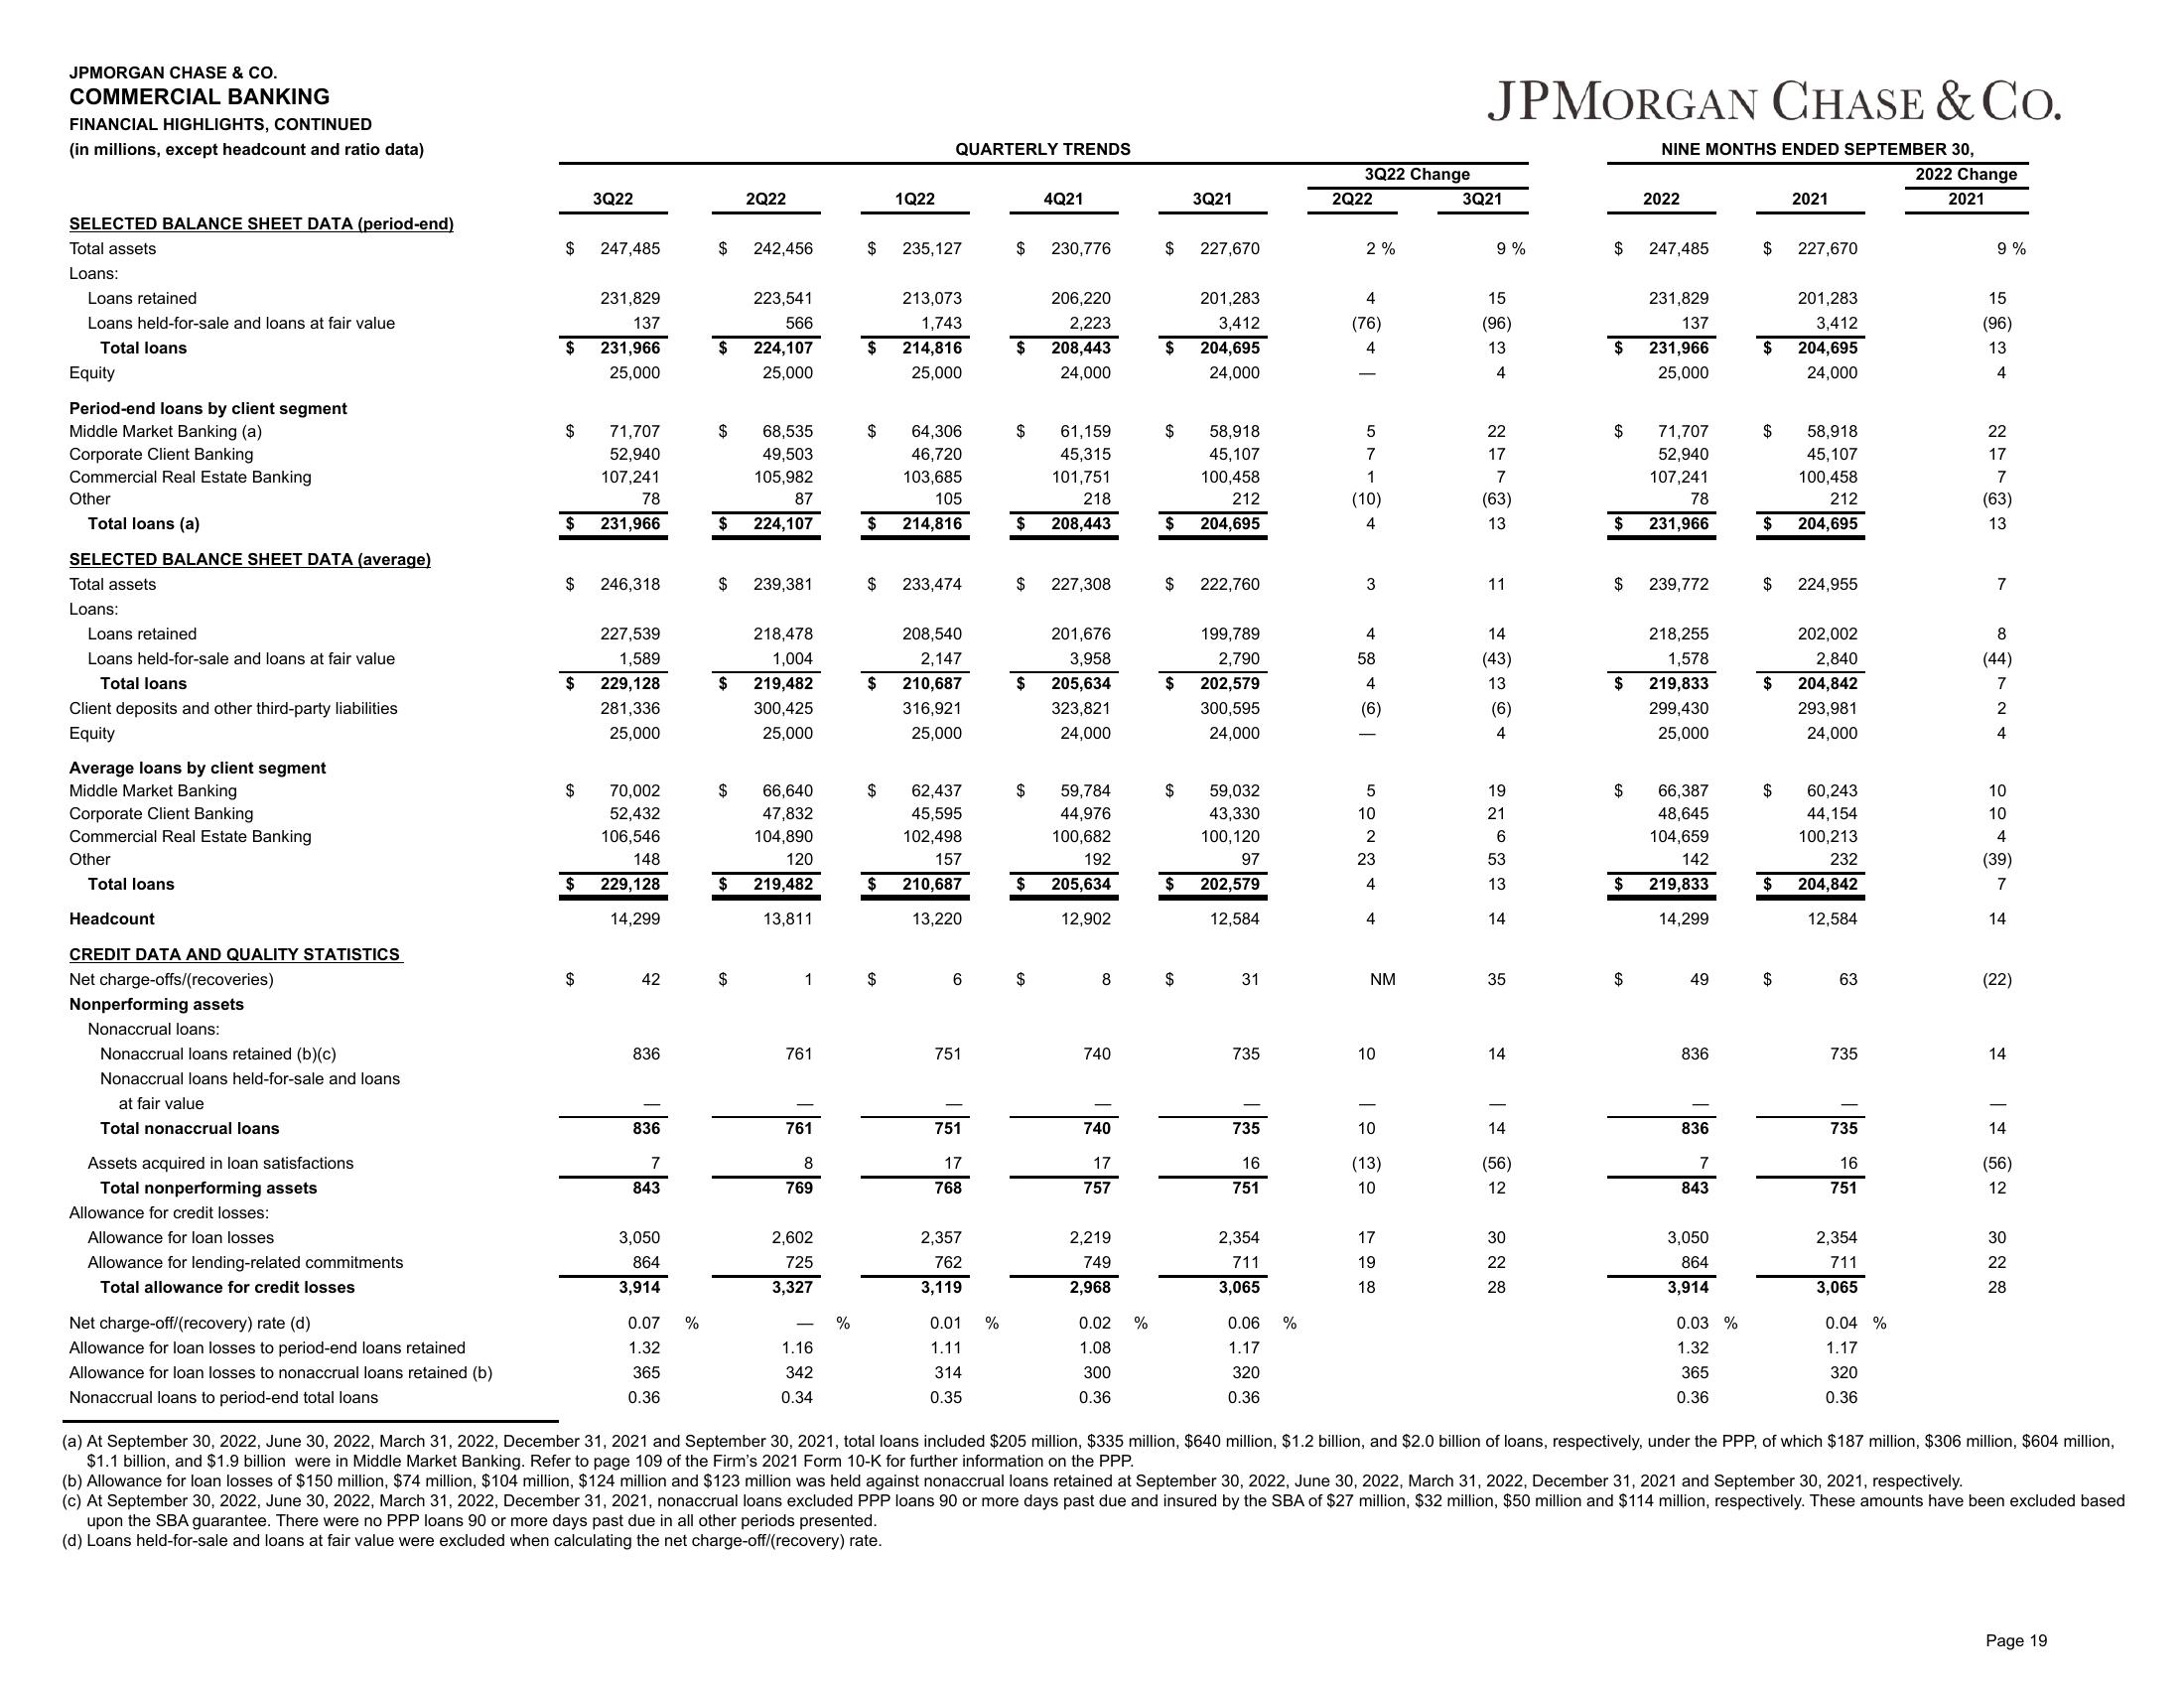
(a) At September 30, 2022, June 30, 2022, March 31, 2022, December 31, 2021 and September 30, 2021, total loans included $205 million, $335 million, $640 million, $1.2 billion, and $2.0 billion of loans, respectively, under the PPP, of which $187 million, $306 million, $604 million,
$1.1 billion, and $1.9 billion were in Middle Market Banking. Refer to page 109 of the Firm's 2021 Form 10-K for further information on the PPP.
(b) Allowance for loan losses of $150 million, $74 million, $104 million, $124 million and $123 million was held against nonaccrual loans retained at September 30, 2022, June 30, 2022, March 31, 2022, December 31, 2021 and September 30, 2021, respectively.
(c) At September 30, 2022, June 30, 2022, March 31, 2022, December 31, 2021, nonaccrual loans excluded PPP loans 90 or more days past due and insured by the SBA of $27 million, $32 million, $50 million and $114 million, respectively. These amounts have been excluded based
upon the SBA guarantee. There were no PPP loans 90 or more days past due in all other periods presented.
(d) Loans held-for-sale and loans at fair value were excluded when calculating the net charge-off/(recovery) rate.
Page 19View entire presentation