Pathward Financial Results Presentation Deck
SUMMARY FINANCIAL RESULTS
First Quarter Ended December 31, 2023
17
●
●
INCOME STATEMENT
($ in thousands, except per share data)
Net interest income
Provision for credit losses
Total noninterest income
Total noninterest expense
Net income before taxes
Income tax expense (benefit)
Net income before non-controlling interest
●
Net income attributable to non-controlling interest
Net income attributable to parent
Less: Allocation of earnings to participating securities¹
Net income attributable to common shareholders¹
Earnings per share, diluted
Average diluted shares
1 Amounts presented are used in the two-class earnings per common share calculation.
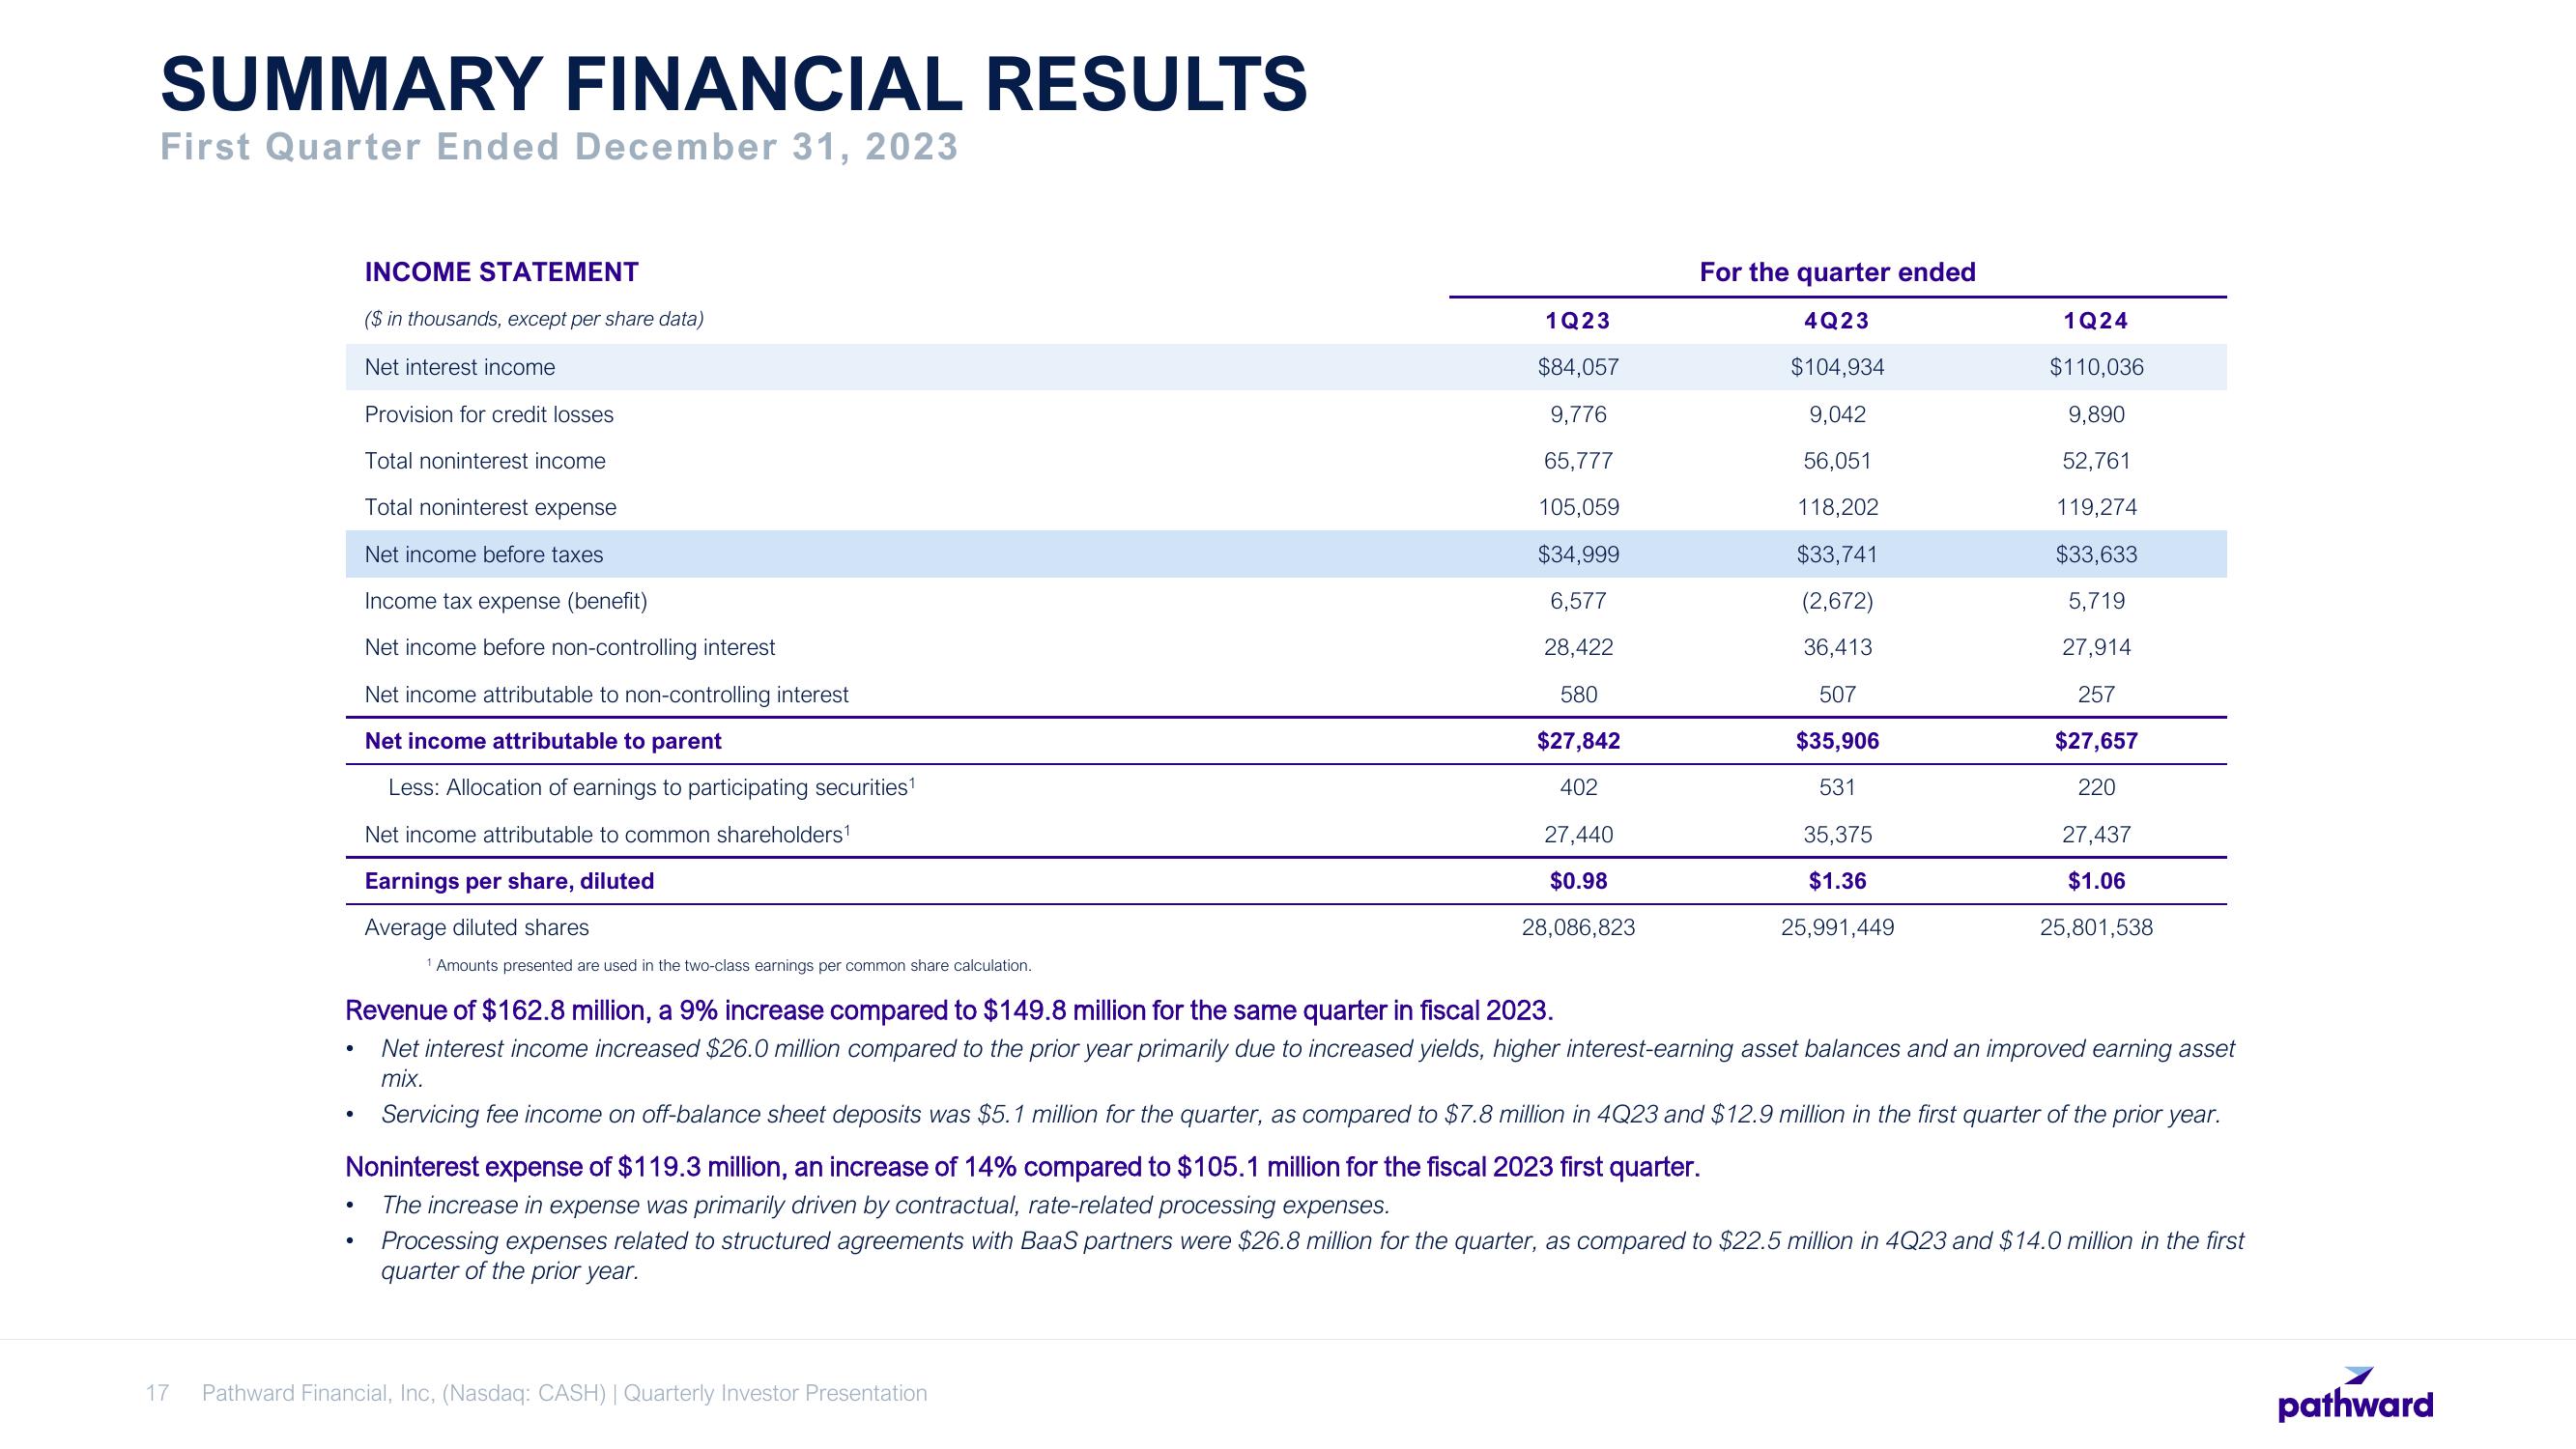
Revenue of $162.8 million, a 9% increase compared to $149.8 million for the same quarter in fiscal 2023.
Net interest income increased $26.0 million compared to the prior year primarily due to increased yields, higher interest-earning asset balances and an improved earning asset
mix.
Servicing fee income on off-balance sheet deposits was $5.1 million for the quarter, as compared to $7.8 million in 4Q23 and $12.9 million in the first quarter of the prior year.
Noninterest expense of $119.3 million, an increase of 14% compared to $105.1 million for the fiscal 2023 first quarter.
The increase in expense was primarily driven by contractual, rate-related processing expenses.
Processing expenses related to structured agreements with BaaS partners were $26.8 million for the quarter, as compared to $22.5 million in 4Q23 and $14.0 million in the first
quarter of the prior year.
1Q23
$84,057
9,776
65,777
105,059
$34,999
6,577
28,422
580
$27,842
402
27,440
$0.98
28,086,823
Pathward Financial, Inc, (Nasdaq: CASH) | Quarterly Investor Presentation
For the quarter ended
4Q23
$104,934
9,042
56,051
118,202
$33,741
(2,672)
36,413
507
$35,906
531
35,375
$1.36
25,991,449
1Q24
$110,036
9,890
52,761
119,274
$33,633
5,719
27,914
257
$27,657
220
27,437
$1.06
25,801,538
pathwardView entire presentation