Bird Investor Presentation Deck
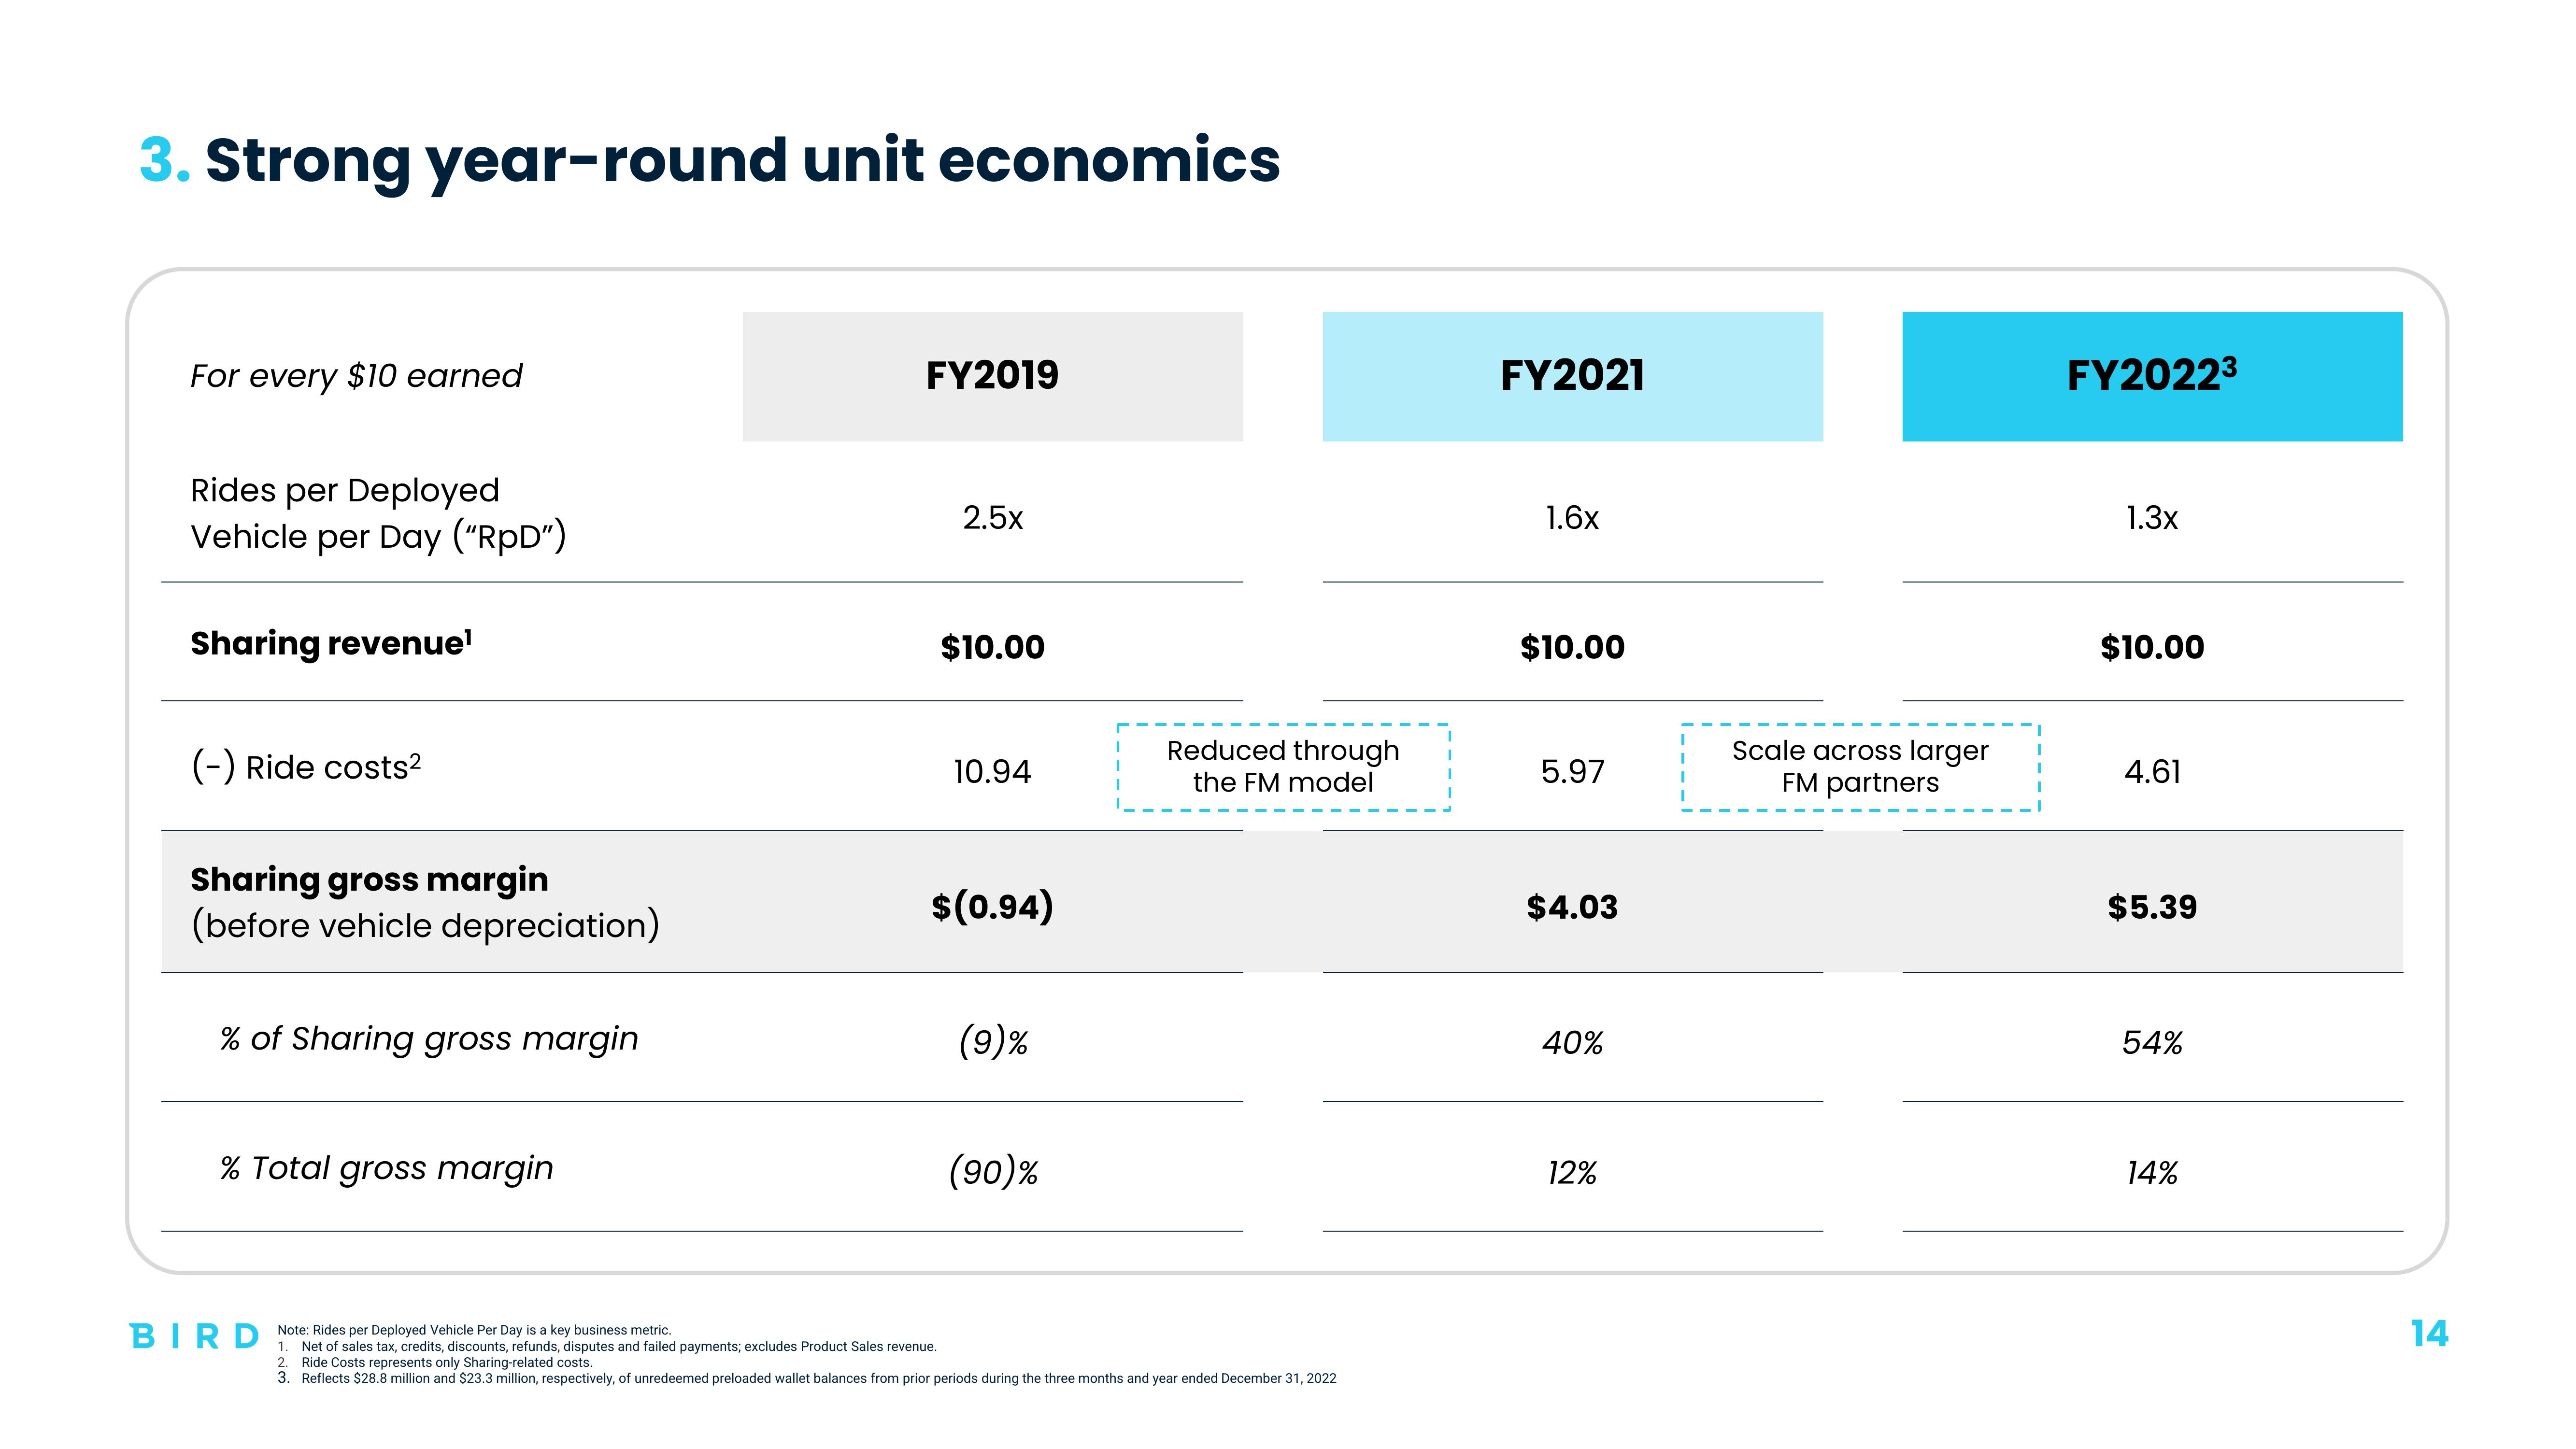
3. Strong year-round unit economics
For every $10 earned
Rides per Deployed
Vehicle per Day ("RpD")
Sharing revenue¹
(-) Ride costs²
Sharing gross margin
(before vehicle depreciation)
% of Sharing gross margin
% Total gross margin
BIRD Note: Rides per Deployed Vehicle Per Day is a key business metric.
FY2019
2.5x
1. Net of sales tax, credits, discounts, refunds, disputes and failed payments; excludes Product Sales revenue.
$10.00
10.94
$(0.94)
(9)%
(90)%
Reduced through
the FM model
2. Ride Costs represents only Sharing-related costs.
3. Reflects $28.8 million and $23.3 million, respectively, of unredeemed preloaded wallet balances from prior periods during the three months and year ended December 31, 2022
FY2021
1.6x
$10.00
5.97
$4.03
40%
12%
Scale across larger
FM partners
FY2022³
1.3x
$10.00
4.61
$5.39
54%
14%
14View entire presentation