Main Street Capital Fixed Income Presentation Deck
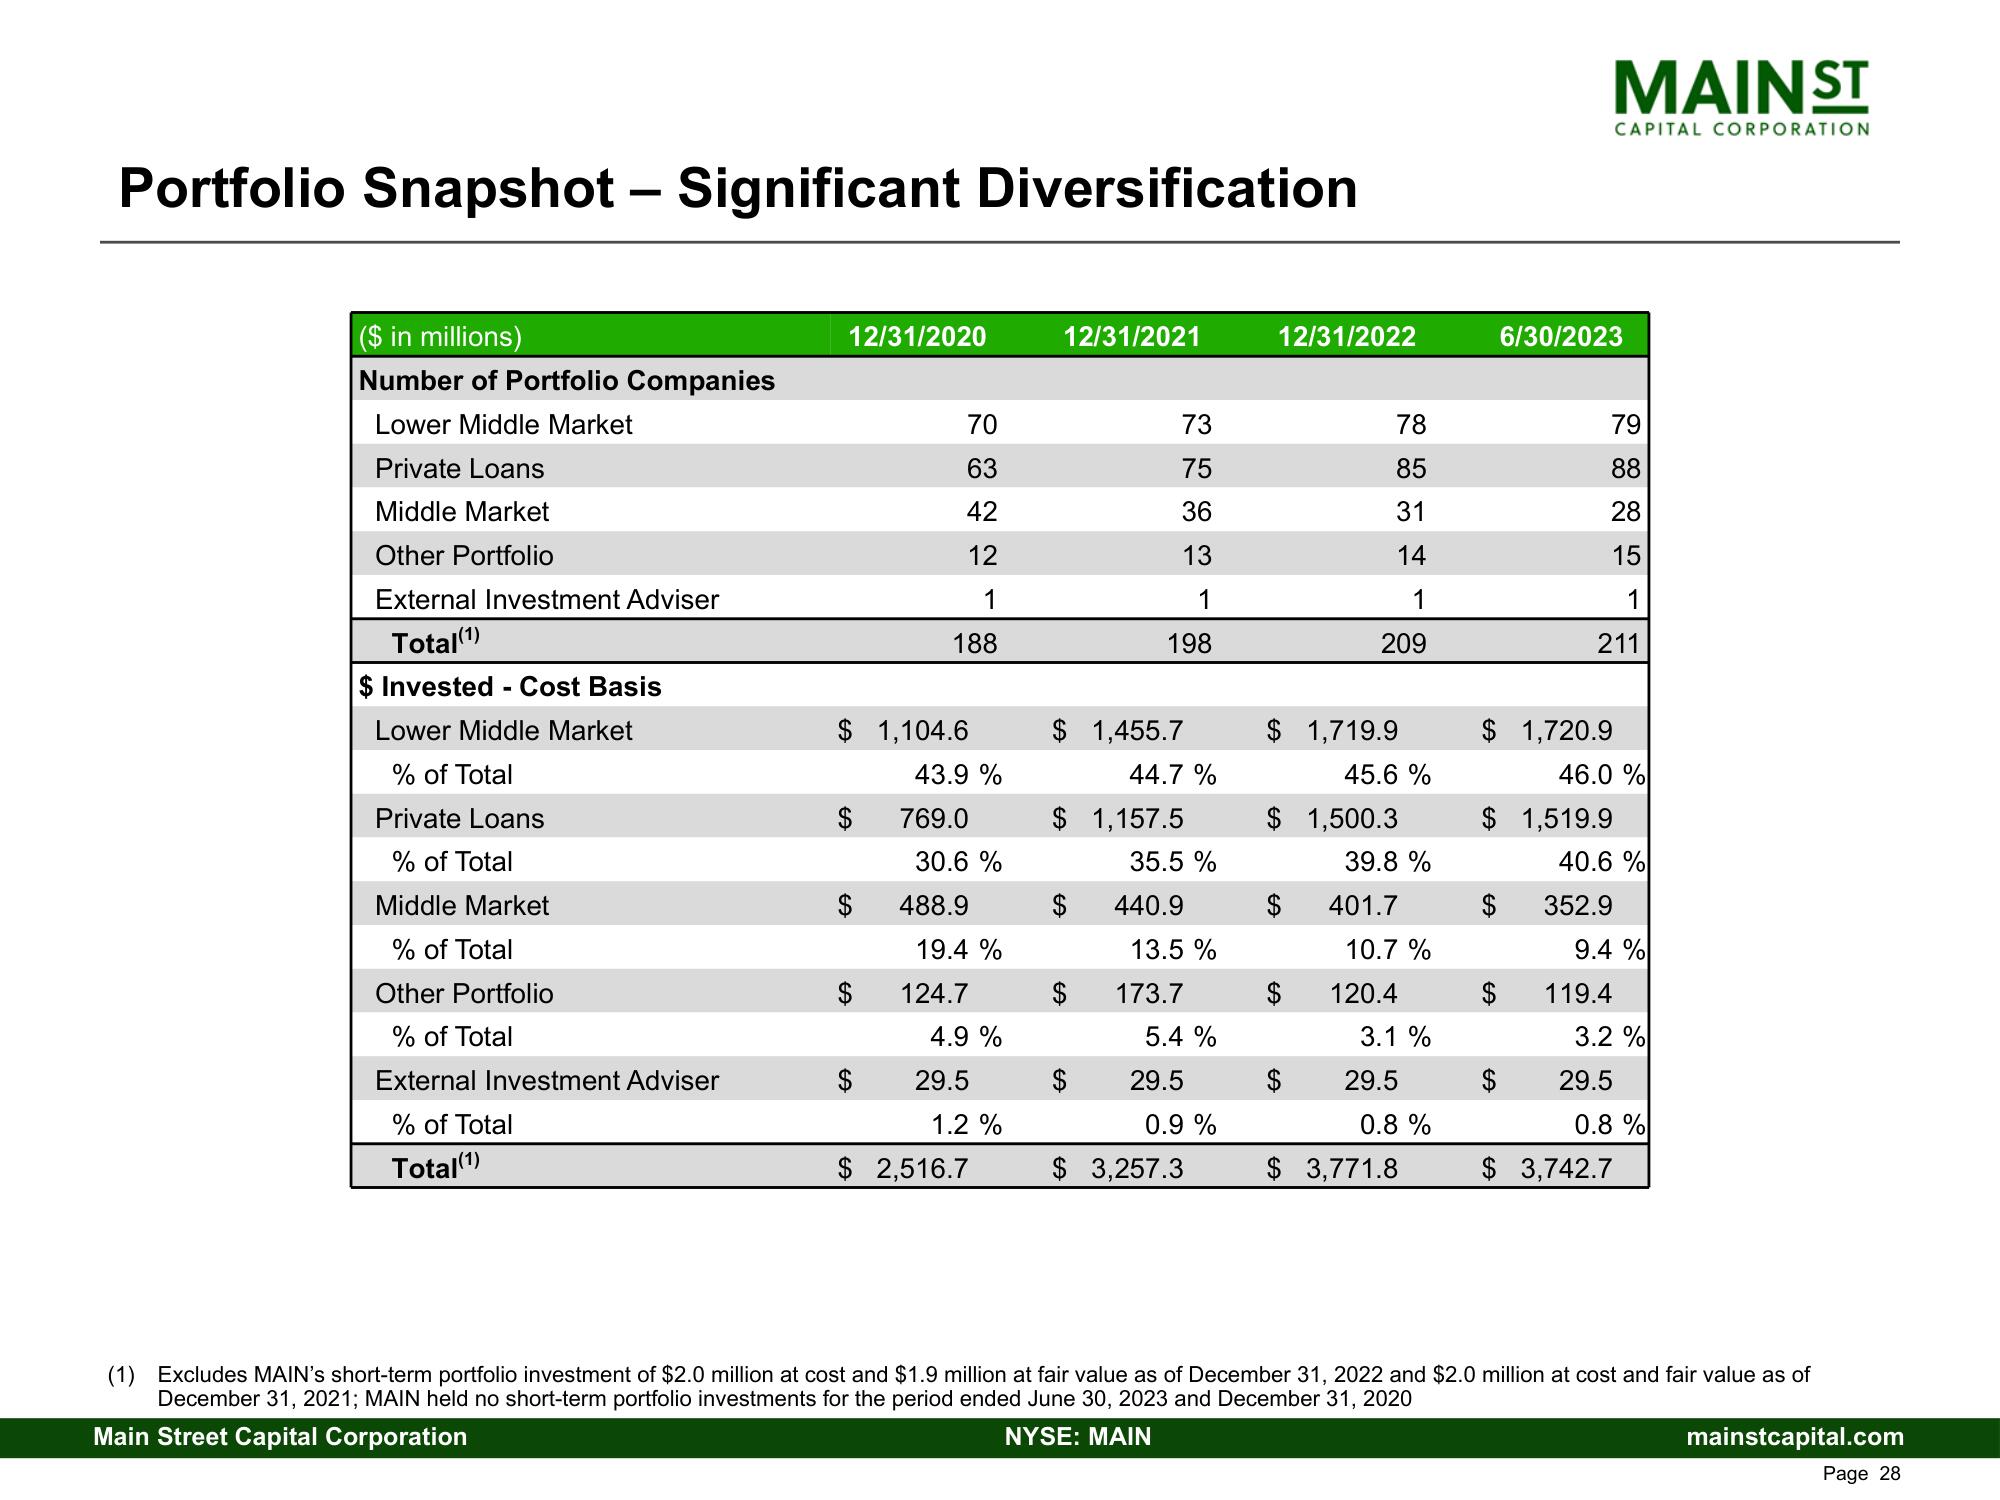
Portfolio Snapshot - Significant Diversification
($ in millions)
Number of Portfolio Companies
Lower Middle Market
Private Loans
Middle Market
Other Portfolio
External Investment Adviser
Total(¹)
$ Invested - Cost Basis
Lower Middle Market
% of Total
Private Loans
% of Total
Middle Market
% of Total
Other Portfolio
% of Total
External Investment Adviser
% of Total
Total(1)
12/31/2020
$ 1,104.6
$
$
$
70
63
42
12
1
188
$
43.9 %
769.0
30.6 %
488.9
19.4%
124.7
4.9 %
29.5
1.2 %
$ 2,516.7
12/31/2021
$ 1,455.7
73
75
36
13
1
198
$
$ 1,157.5
$
44.7%
35.5 %
440.9
13.5 %
173.7
5.4 %
29.5
0.9 %
$ 3,257.3
12/31/2022
$ 1,719.9
78
85
31
14
1
209
$
$ 1,500.3
$
45.6 %
39.8 %
401.7
10.7 %
120.4
3.1 %
29.5
0.8 %
3,771.8
MAIN ST
6/30/2023
$ 1,720.9
79
88
28
15
1
211
CAPITAL CORPORATION
$ 1,519.9
46.0 %
40.6 %
352.9
9.4 %
119.4
3.2 %
29.5
0.8 %
$ 3,742.7
(1) Excludes MAIN's short-term portfolio investment of $2.0 million at cost and $1.9 million at fair value as of December 31, 2022 and $2.0 million at cost and fair value as of
December 31, 2021; MAIN held no short-term portfolio investments for the period ended June 30, 2023 and December 31, 2020
Main Street Capital Corporation
NYSE: MAIN
mainstcapital.com
Page 28View entire presentation