Third Quarter Fiscal 2023
FINANCIAL REVIEW
(In millions)
Net Sales
Gross Profit
% of net sales
SG&A expenses
% of net sales
Operating Income
% of net sales
Adjusted EBITDA*
% of net sales
Adjusted EPS*
Q3 FY23
$560.0
97.6
17.4%
58.0
10.3%
39.5
7.1%
53.3
9.5%
$0.48
Q3 FY22
$502.2
74.6
14.9%
50.3
10.0%
79.4
15.8%
39.3
7.8%
$0.31
* See appendix for the full GAAP income statement and Non-GAAP reconciliations
(In millions)
Net Sales
$502.2
Q3 FY22
12%
$560.0
Q3 FY23
Adjusted EBITDA &
EBITDA Margin*
$53.3
$39.3
7.8%
MODINE
Engineering a Cleaner, Healthier World
Q3 FY22
36%
9.5%
Q3 FY23
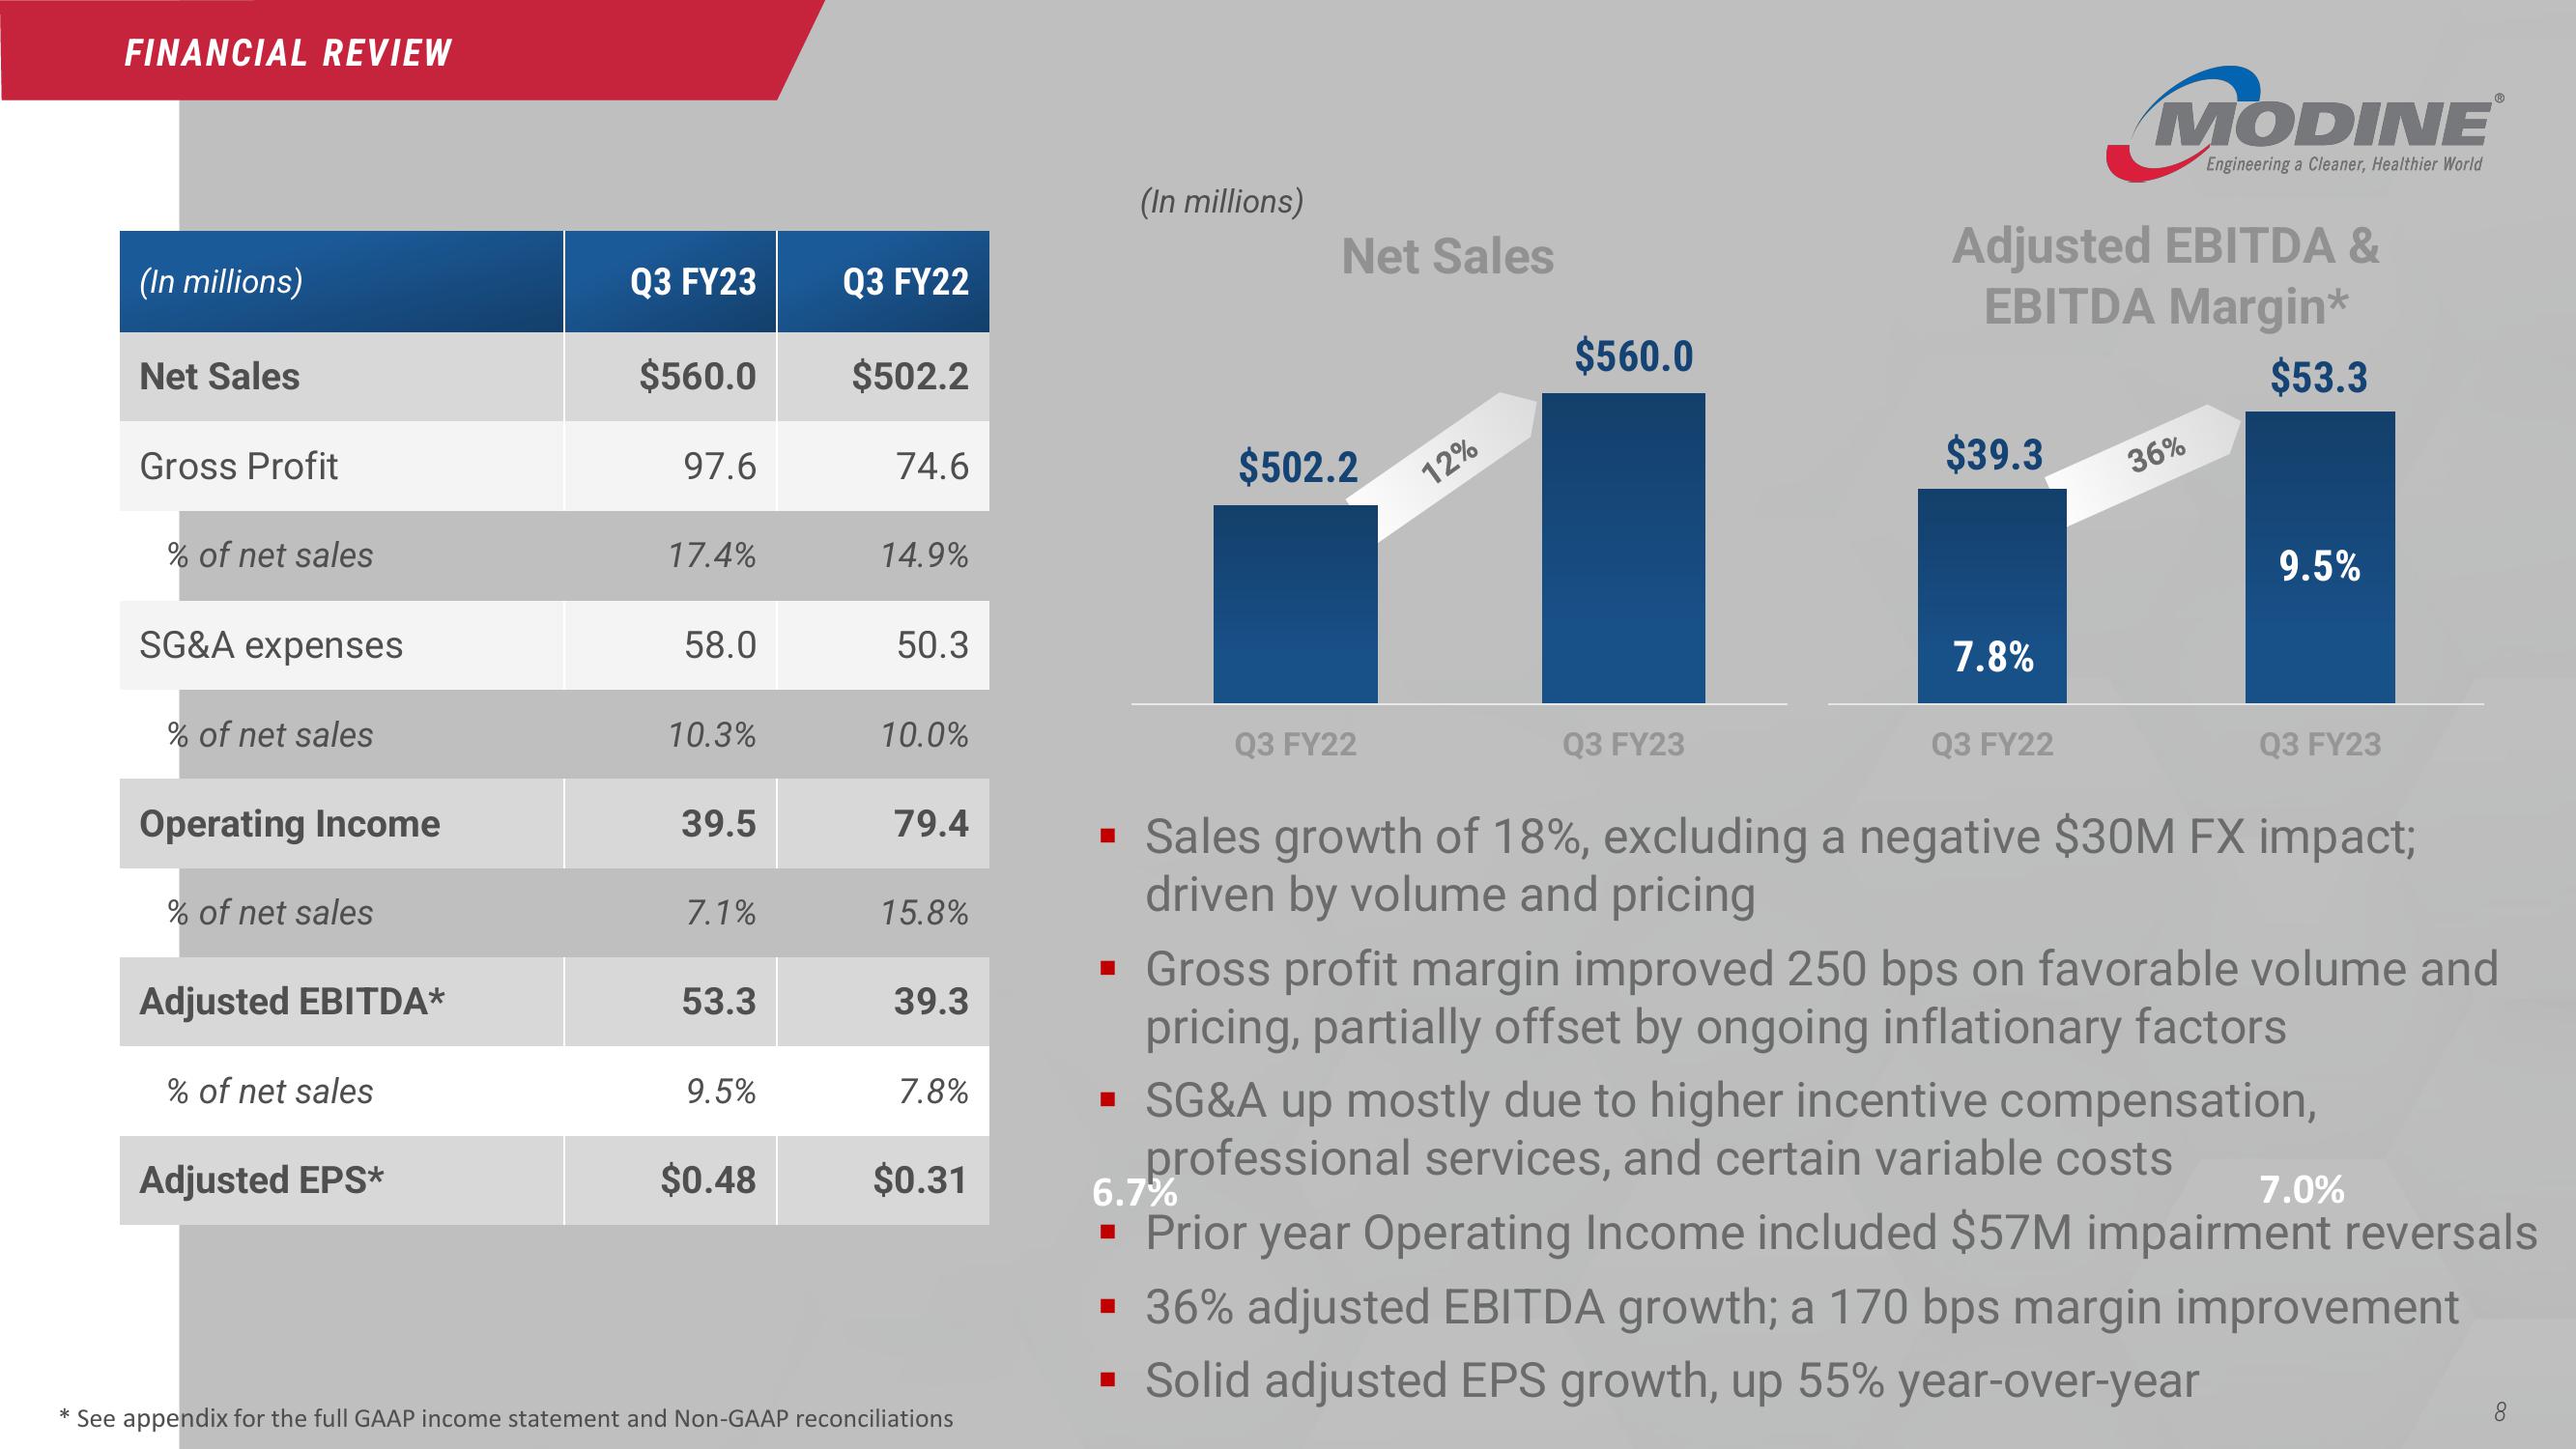
▪ Sales growth of 18%, excluding a negative $30M FX impact;
driven by volume and pricing
▪ Gross profit margin improved 250 bps on favorable volume and
pricing, partially offset by ongoing inflationary factors
▪ SG&A up mostly due to higher incentive compensation,
professional services, and certain variable costs
7.0%
6.7%
▪ Prior year Operating Income included $57M impairment reversals
▪ 36% adjusted EBITDA growth; a 170 bps margin improvement
▪ Solid adjusted EPS growth, up 55% year-over-year
8View entire presentation