Cytek Investor Presentation Deck
Note: Fiscal Quarter
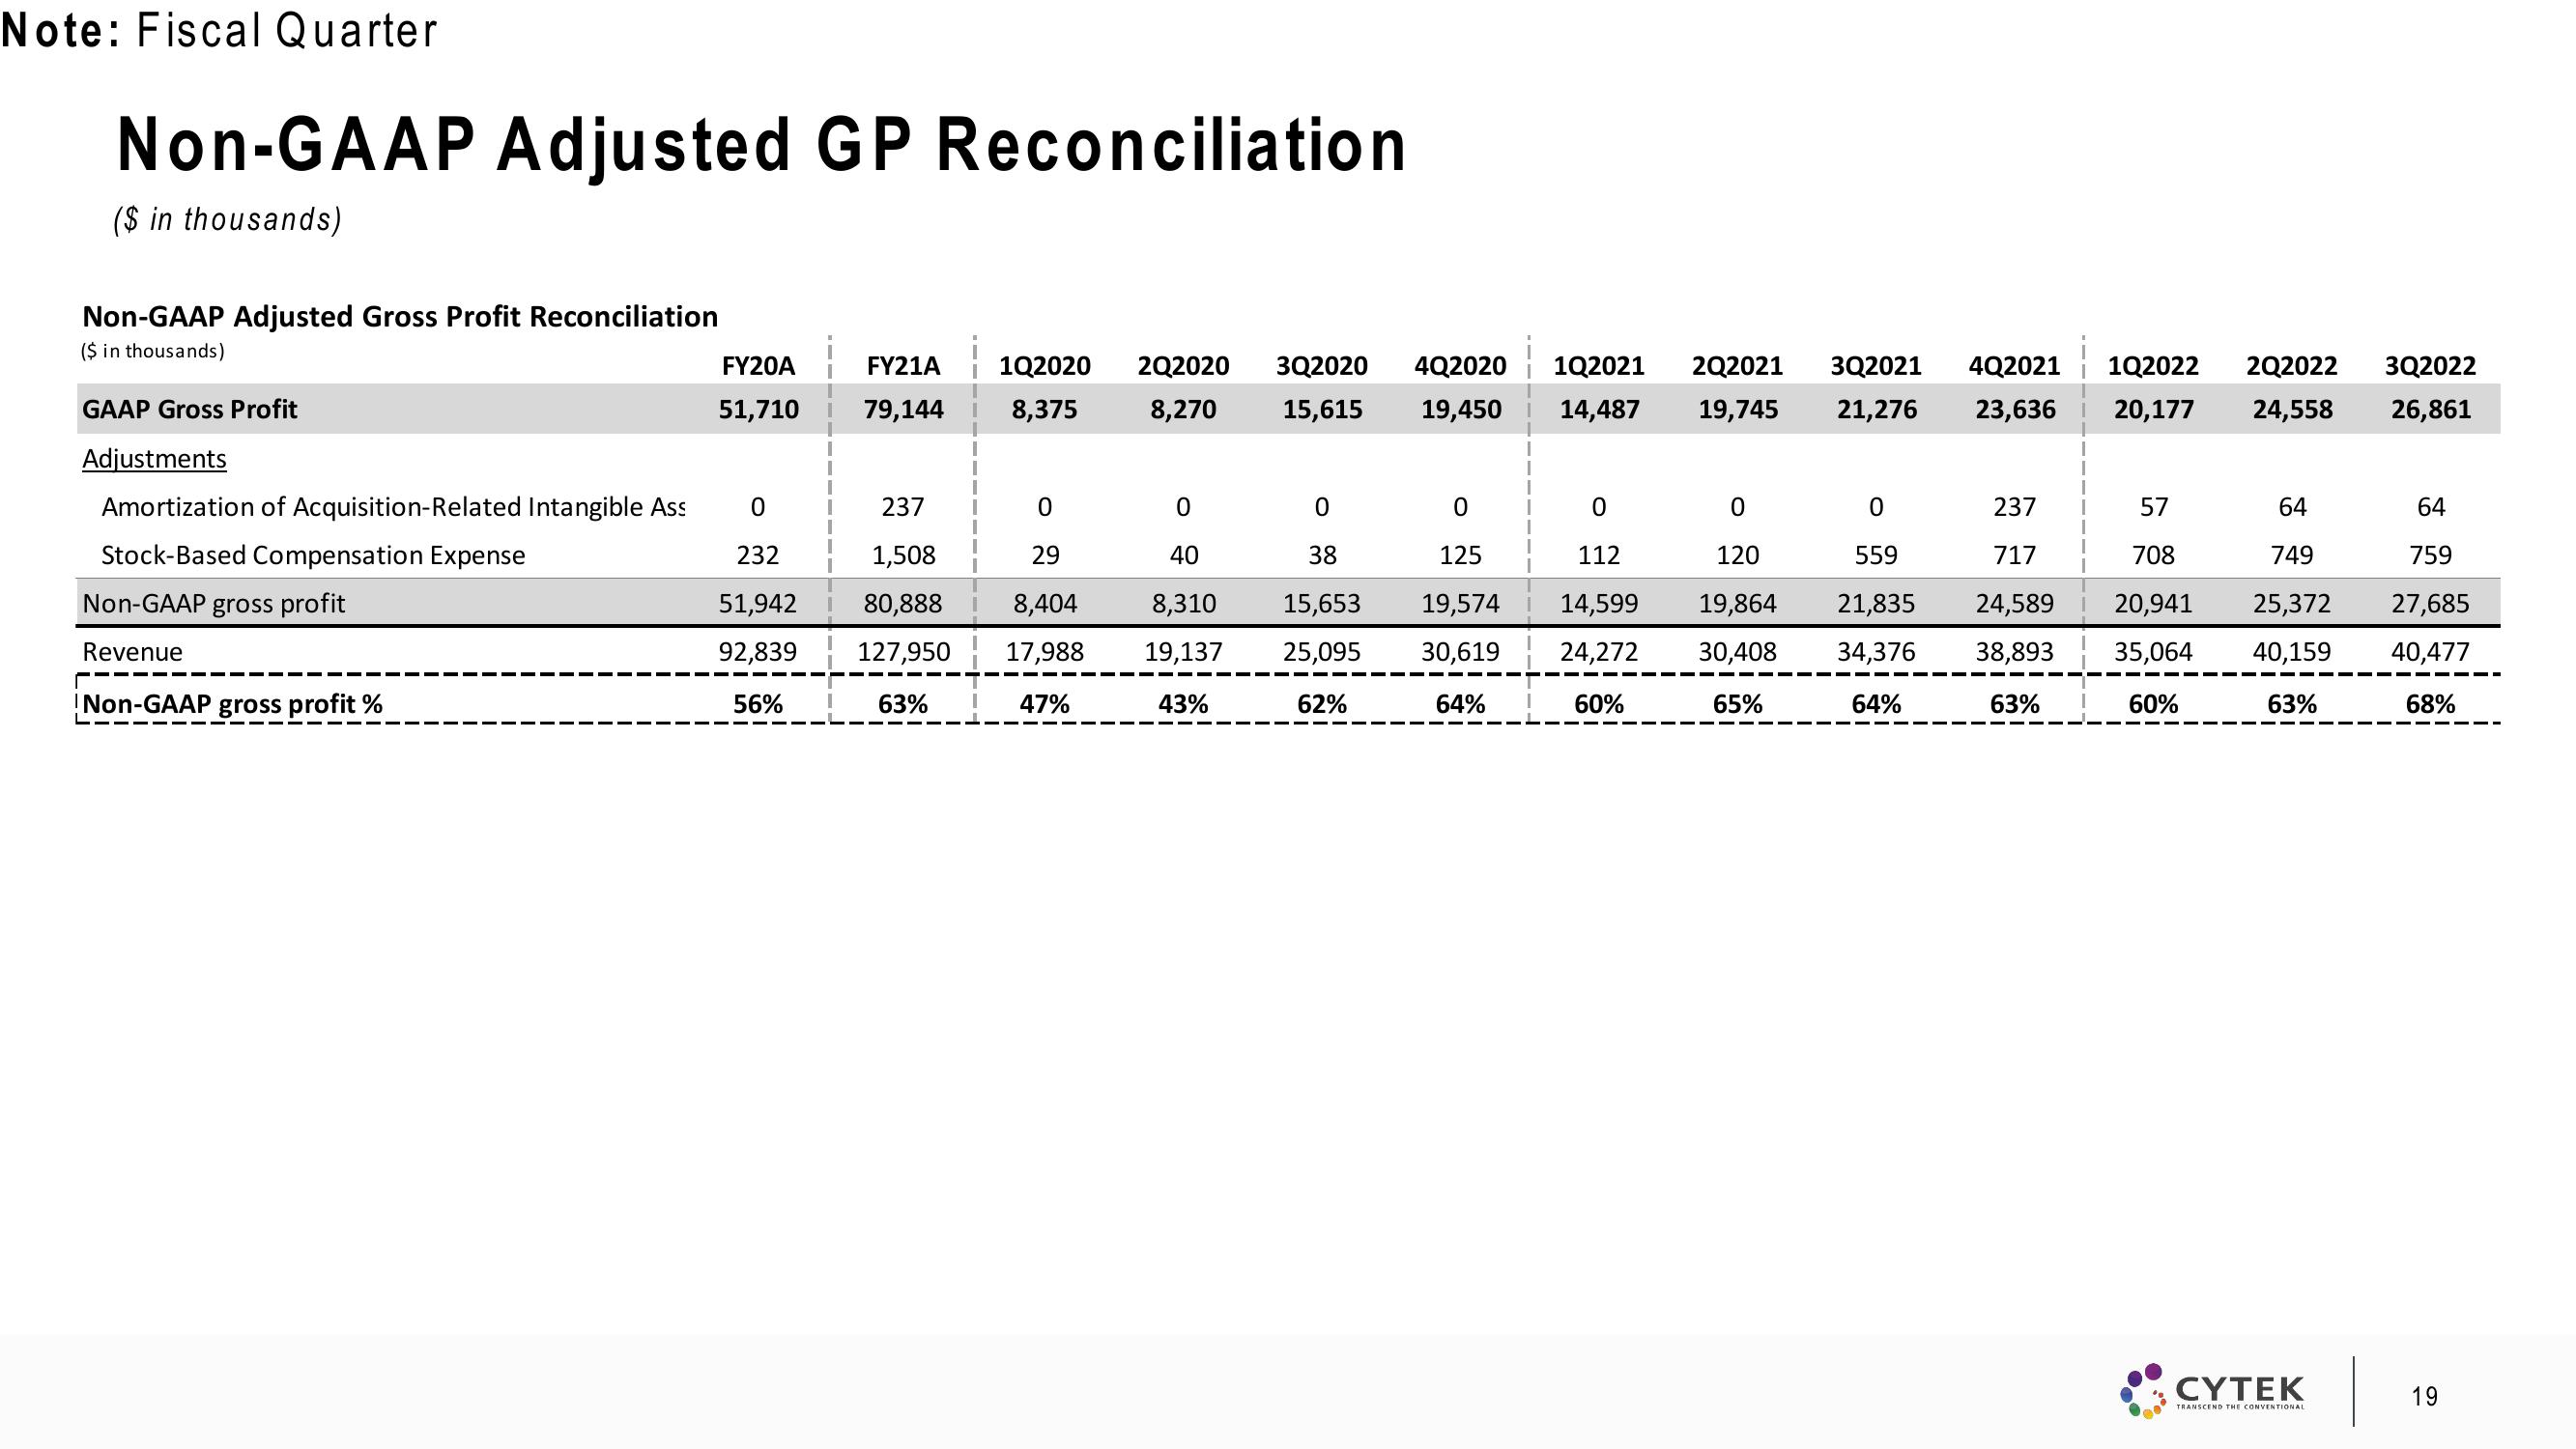
Non-GAAP Adjusted GP Reconciliation
($ in thousands)
Non-GAAP Adjusted Gross Profit Reconciliation
($ in thousands)
GAAP Gross Profit
Adjustments
Amortization of Acquisition-Related Intangible Ass
Stock-Based Compensation Expense
Non-GAAP gross profit
Revenue
Non-GAAP gross profit %
FY20A
51,710
FY21A
79,144
0
237
232
1,508
51,942 I 80,888
92,839 127,950
56%
63%
1Q2020 2Q2020
8,375 8,270
0
29
8,404
17,988
47%
0
40
8,310
19,137
43%
3Q2020 4Q2020 1Q2021 2Q2021 3Q2021 4Q2021 1Q2022
15,615 19,450 14,487 19,745 21,276 23,636 20,177
0
38
15,653
25,095
62%
0
125
19,574
30,619
64%
0
0
0
112
120
559
14,599 19,864 21,835
24,272 30,408 34,376
65%
64%
60%
237
717
24,589
38,893
63%
2Q2022 3Q2022
24,558 26,861
57
64
708
749
20,941 25,372
35,064
60%
64
759
27,685
40,159 40,477
63%
68%
CYTEK
TRANSCEND THE CONVENTIONAL
19View entire presentation