Q4 2020 Investor Presentation
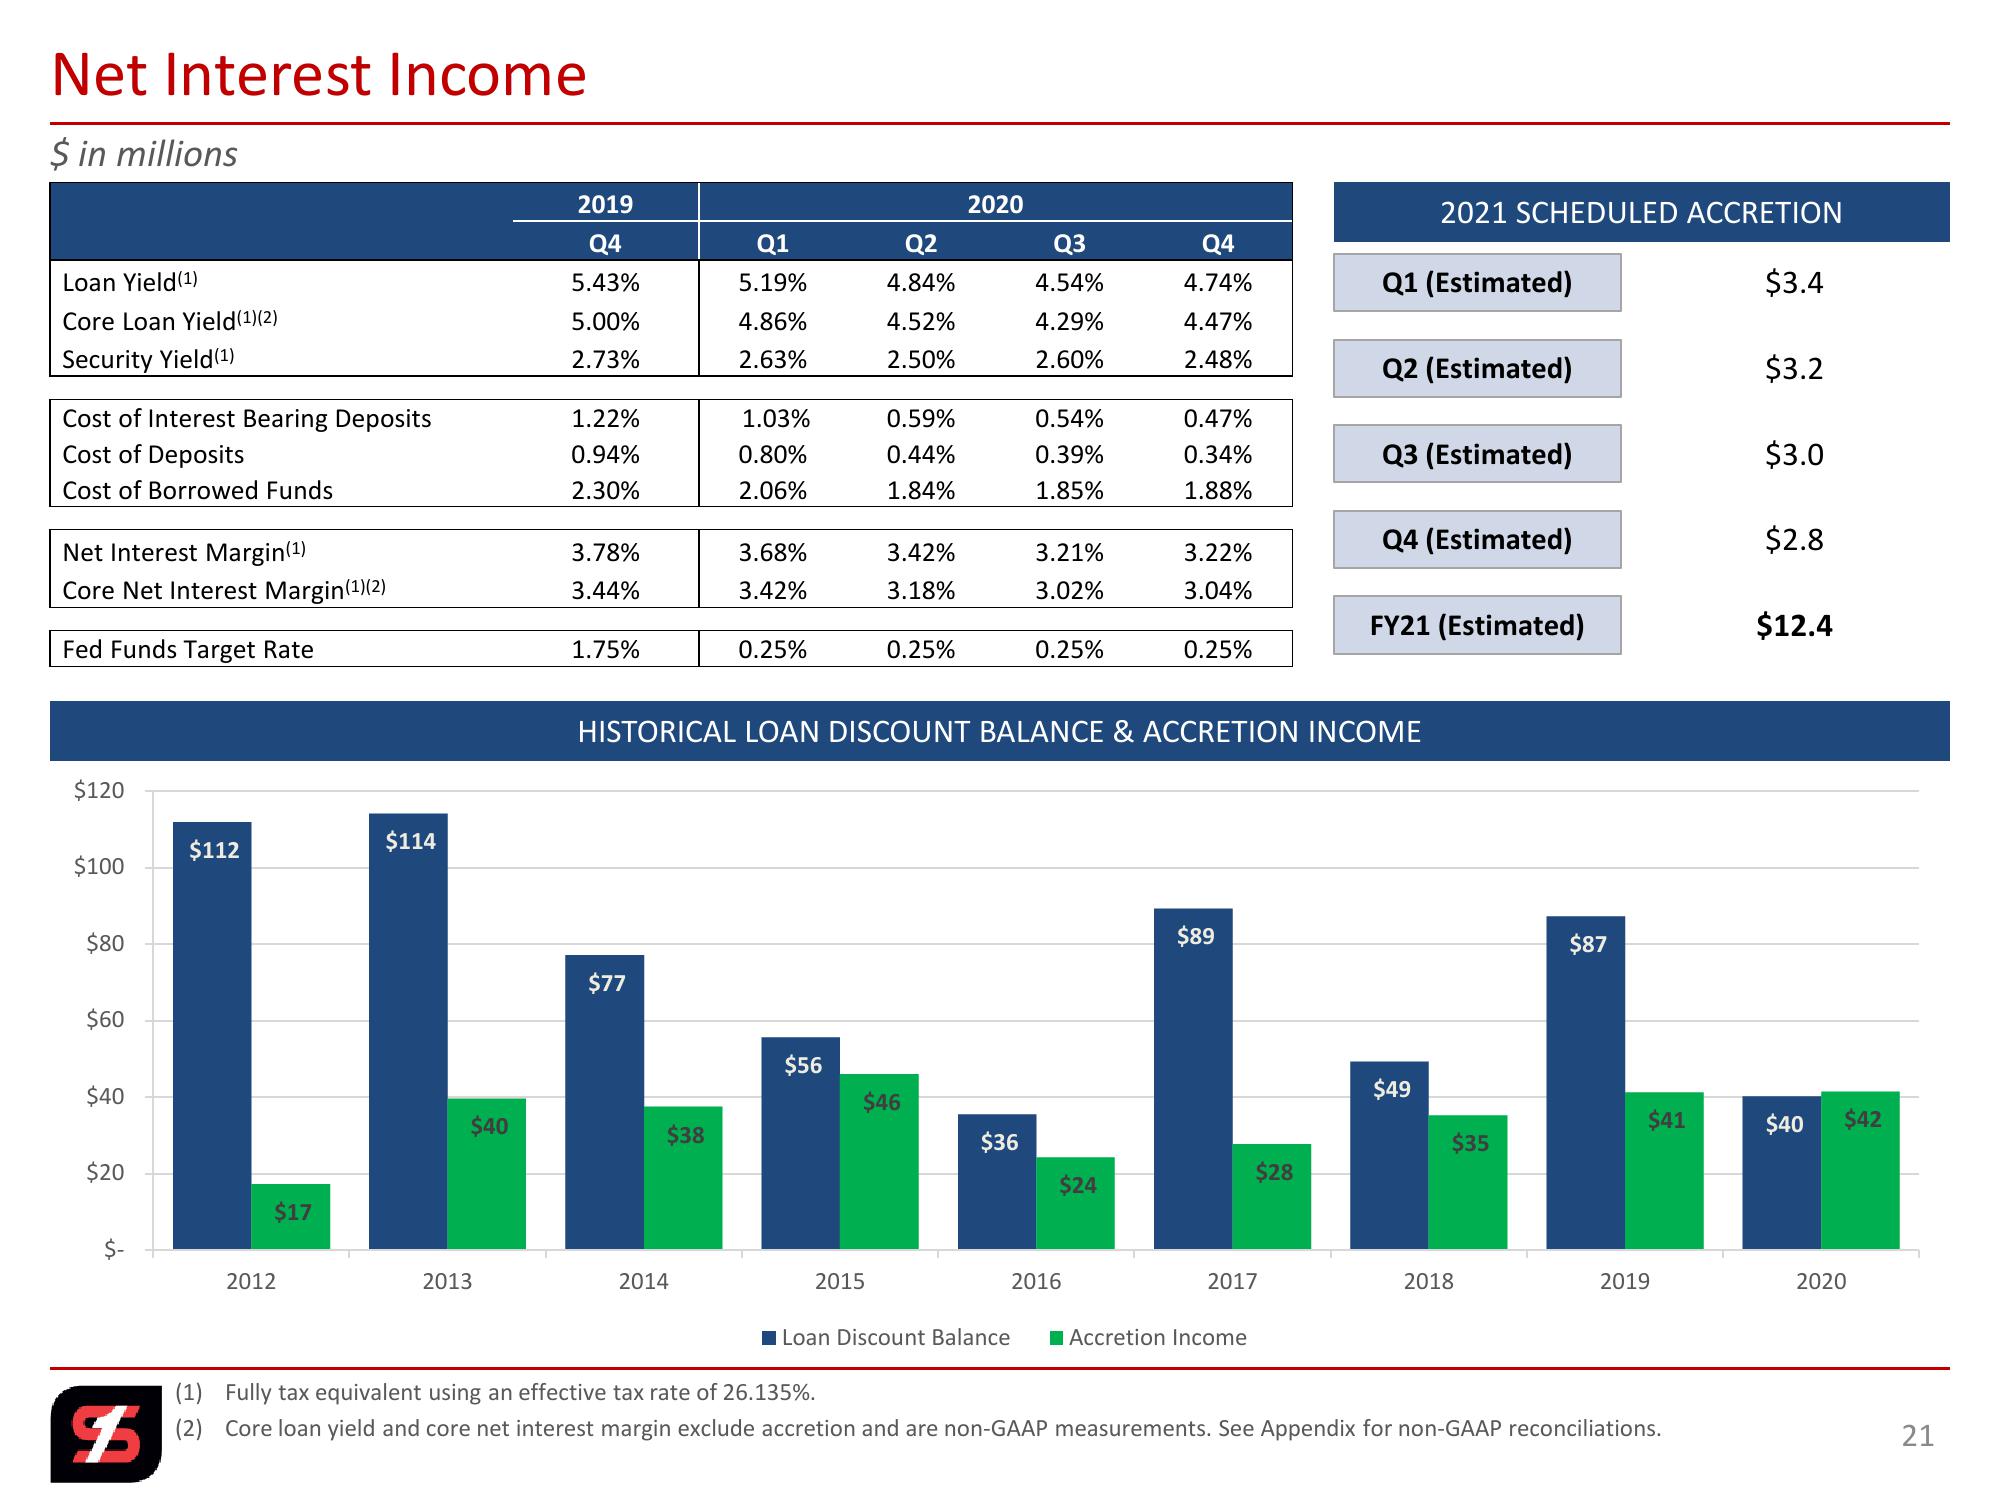
Net Interest Income
$ in millions
2019
2020
2021 SCHEDULED ACCRETION
Q4
Q1
Q2
Q3
Q4
Loan Yield(1)
5.43%
5.19%
4.84%
4.54%
4.74%
Q1 (Estimated)
$3.4
Core Loan Yield (1)(2)
5.00%
4.86%
4.52%
4.29%
4.47%
Security Yield(1)
2.73%
2.63%
2.50%
2.60%
2.48%
Q2 (Estimated)
$3.2
Cost of Interest Bearing Deposits
1.22%
1.03%
0.59%
0.54%
0.47%
Cost of Deposits
0.94%
0.80%
0.44%
0.39%
0.34%
Q3 (Estimated)
$3.0
Cost of Borrowed Funds
2.30%
2.06%
1.84%
1.85%
1.88%
Net Interest Margin (1)
3.78%
3.68%
3.42%
3.21%
Q4 (Estimated)
$2.8
3.22%
Core Net Interest Margin (1)(2)
3.44%
3.42%
3.18%
3.02%
3.04%
FY21 (Estimated)
$12.4
Fed Funds Target Rate
1.75%
0.25%
0.25%
0.25%
0.25%
$120
$112
$114
HISTORICAL LOAN DISCOUNT BALANCE & ACCRETION INCOME
$100
$80
$60
$40
$20
$77
LLL
$17
$89
$56
$46
$40
$38
$36
$28
$24
$87
$49
$41
$40 $42
$35
2012
2013
2014
2015
2016
2017
2018
2019
2020
Loan Discount Balance
Accretion Income
(1)
Fully tax equivalent using an effective tax rate of 26.135%.
$
(2)
Core loan yield and core net interest margin exclude accretion and are non-GAAP measurements. See Appendix for non-GAAP reconciliations.
21View entire presentation