Experian ESG Presentation Deck
Executive Summary
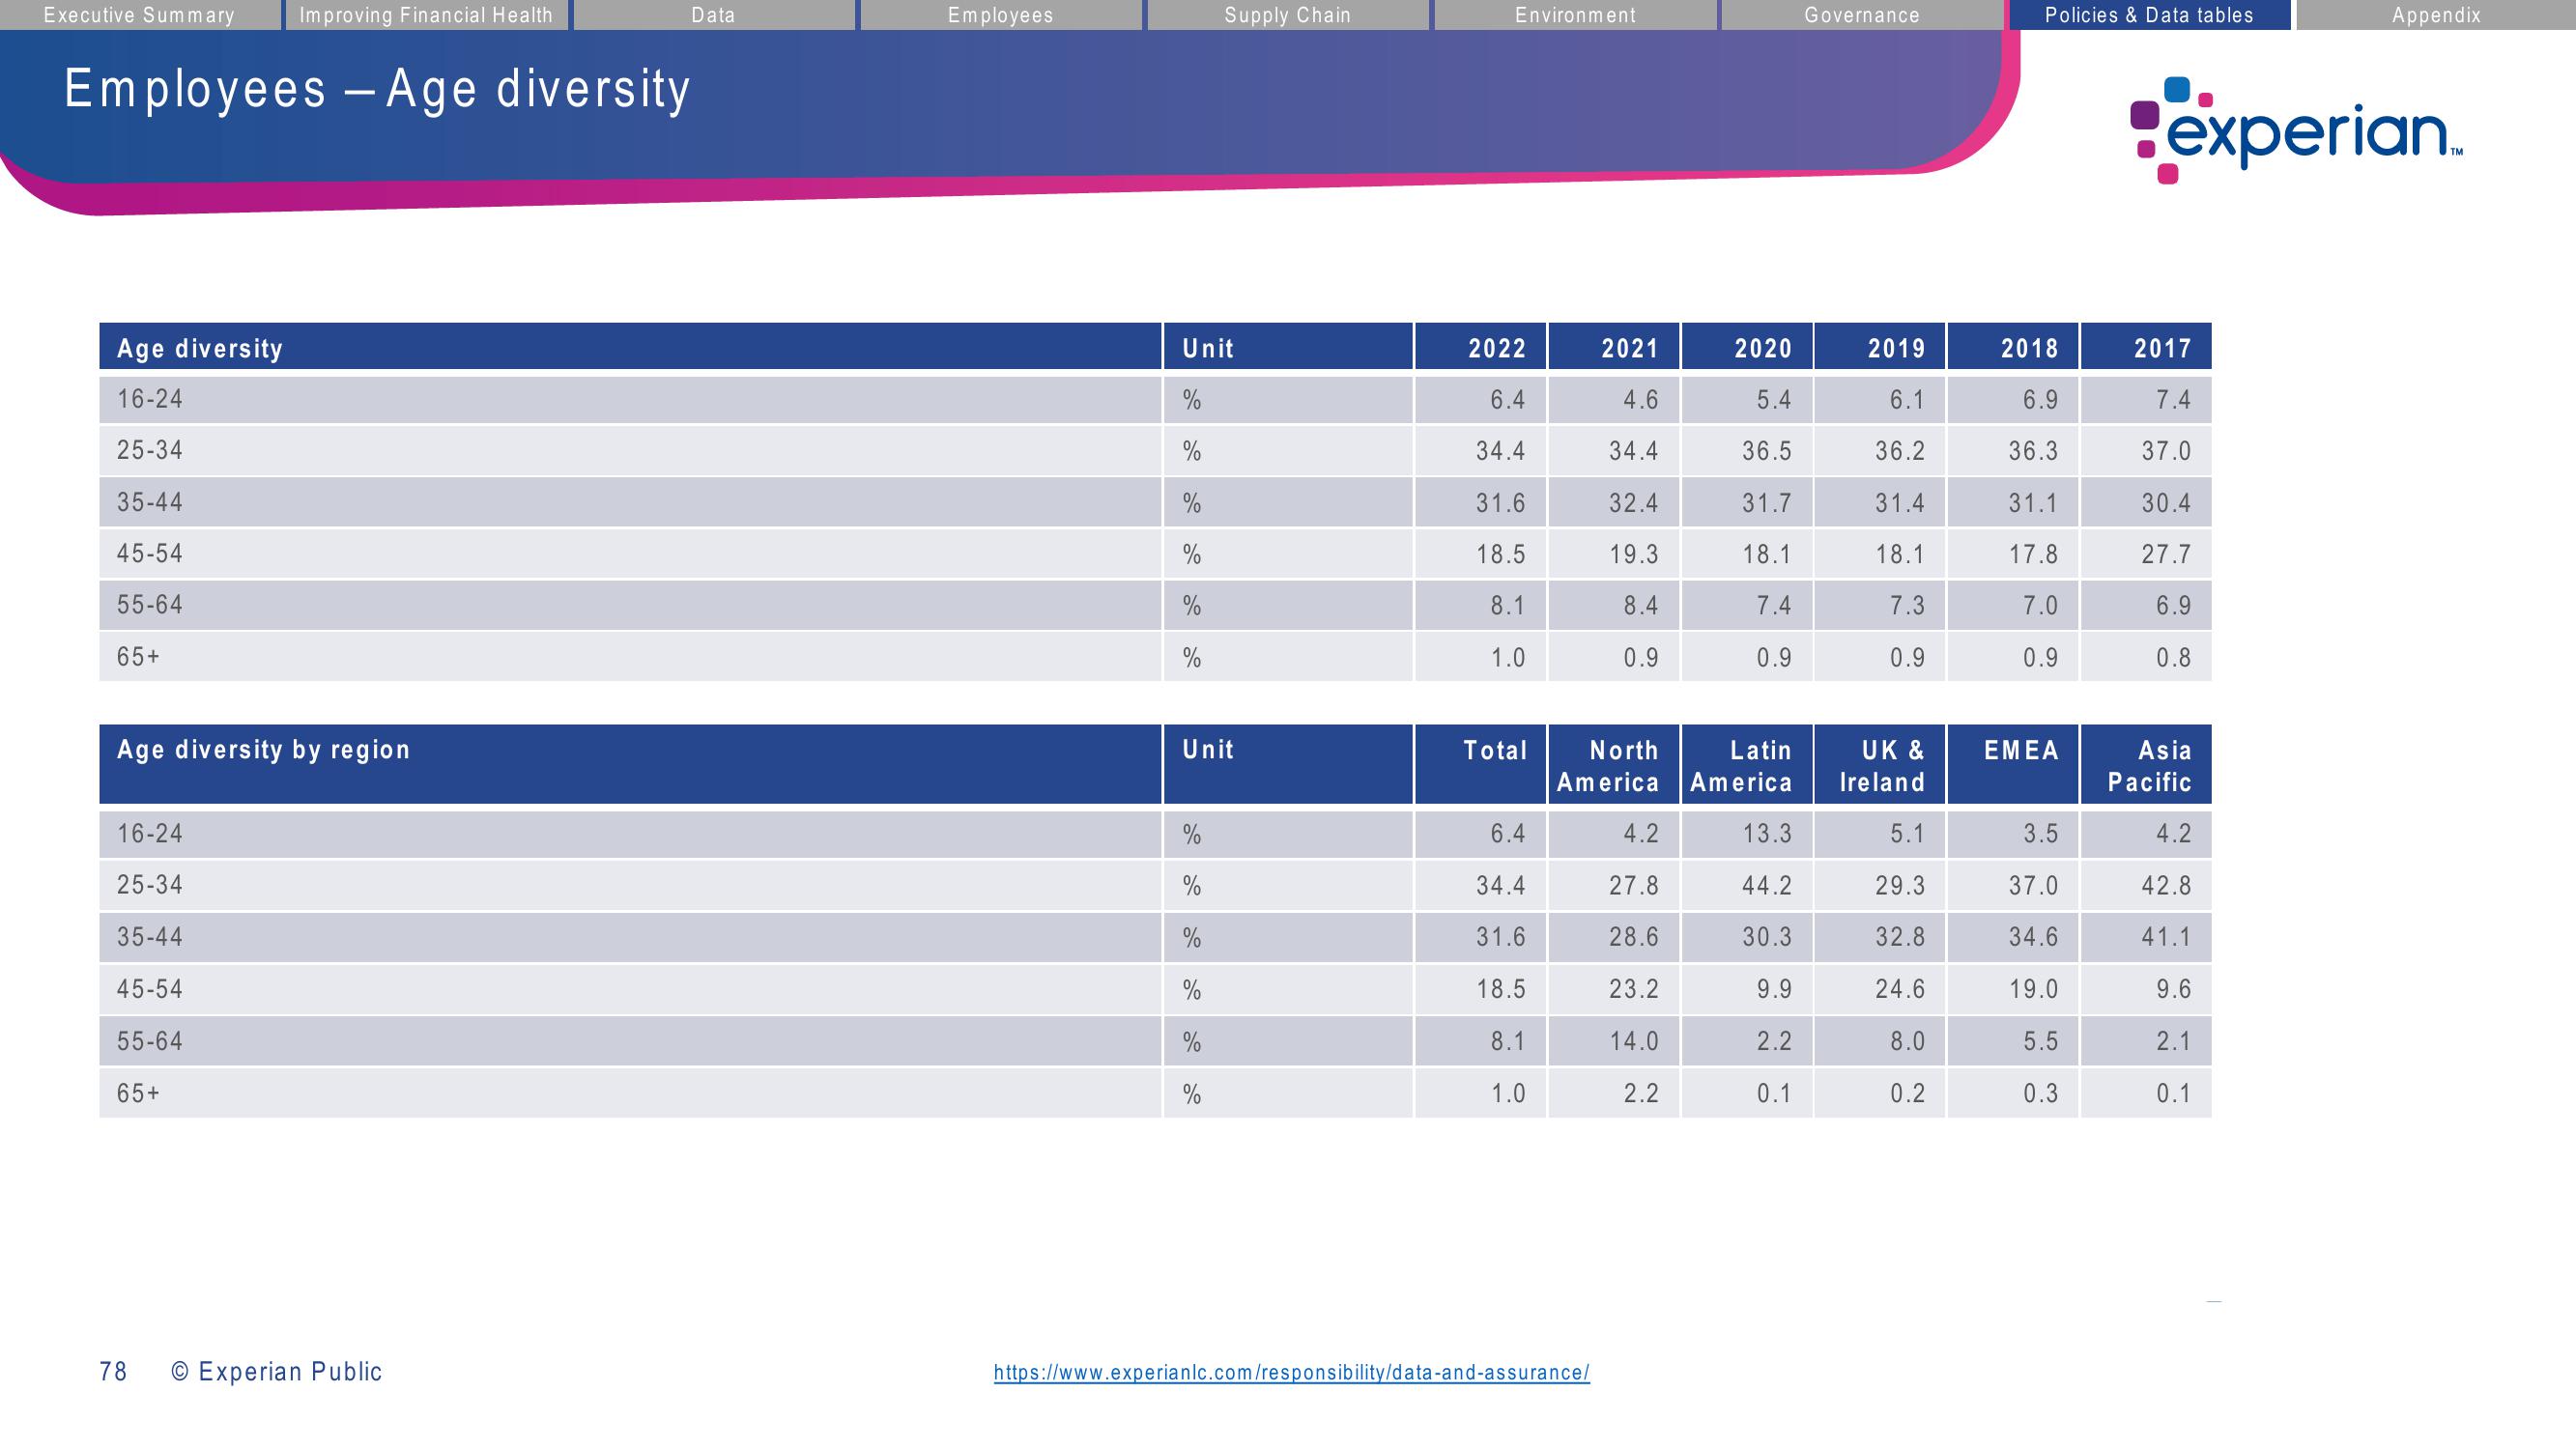
Age diversity
16-24
25-34
35-44
45-54
55-64
65+
Employees - Age diversity
Improving Financial Health
Age diversity by region
16-24
25-34
35-44
45-54
55-64
65+
78
Data
O Experian Public
Employees
Unit
%
%
%
Supply Chain
Unit
%
%
%
%
Environment
2022
6.4
34.4
31.6
18.5
8.1
1.0
Total
6.4
34.4
31.6
18.5
8.1
1.0
2021
4.6
34.4
32.4
19.3
8.4
0.9
https://www.experianlc.com/responsibility/data-and-assurance/
North Latin
America America
2020
5.4
36.5
31.7
18.1
7.4
0.9
4.2
27.8
28.6
23.2
14.0
2.2
13.3
44.2
30.3
9.9
2.2
0.1
Governance
2019
6.1
36.2
31.4
18.1
7.3
0.9
UK &
Ireland
5.1
29.3
32.8
24.6
8.0
0.2
Policies & Data tables
2018
6.9
36.3
31.1
17.8
7.0
0.9
EMEA
3.5
37.0
34.6
19.0
5.5
0.3
experian.
2017
7.4
37.0
30.4
27.7
6.9
0.8
Asia
Pacific
4.2
Appendix
42.8
41.1
9.6
2.1
0.1View entire presentation