GlobalFoundries Results Presentation Deck
Key Q3'23 Results
(Unaudited)
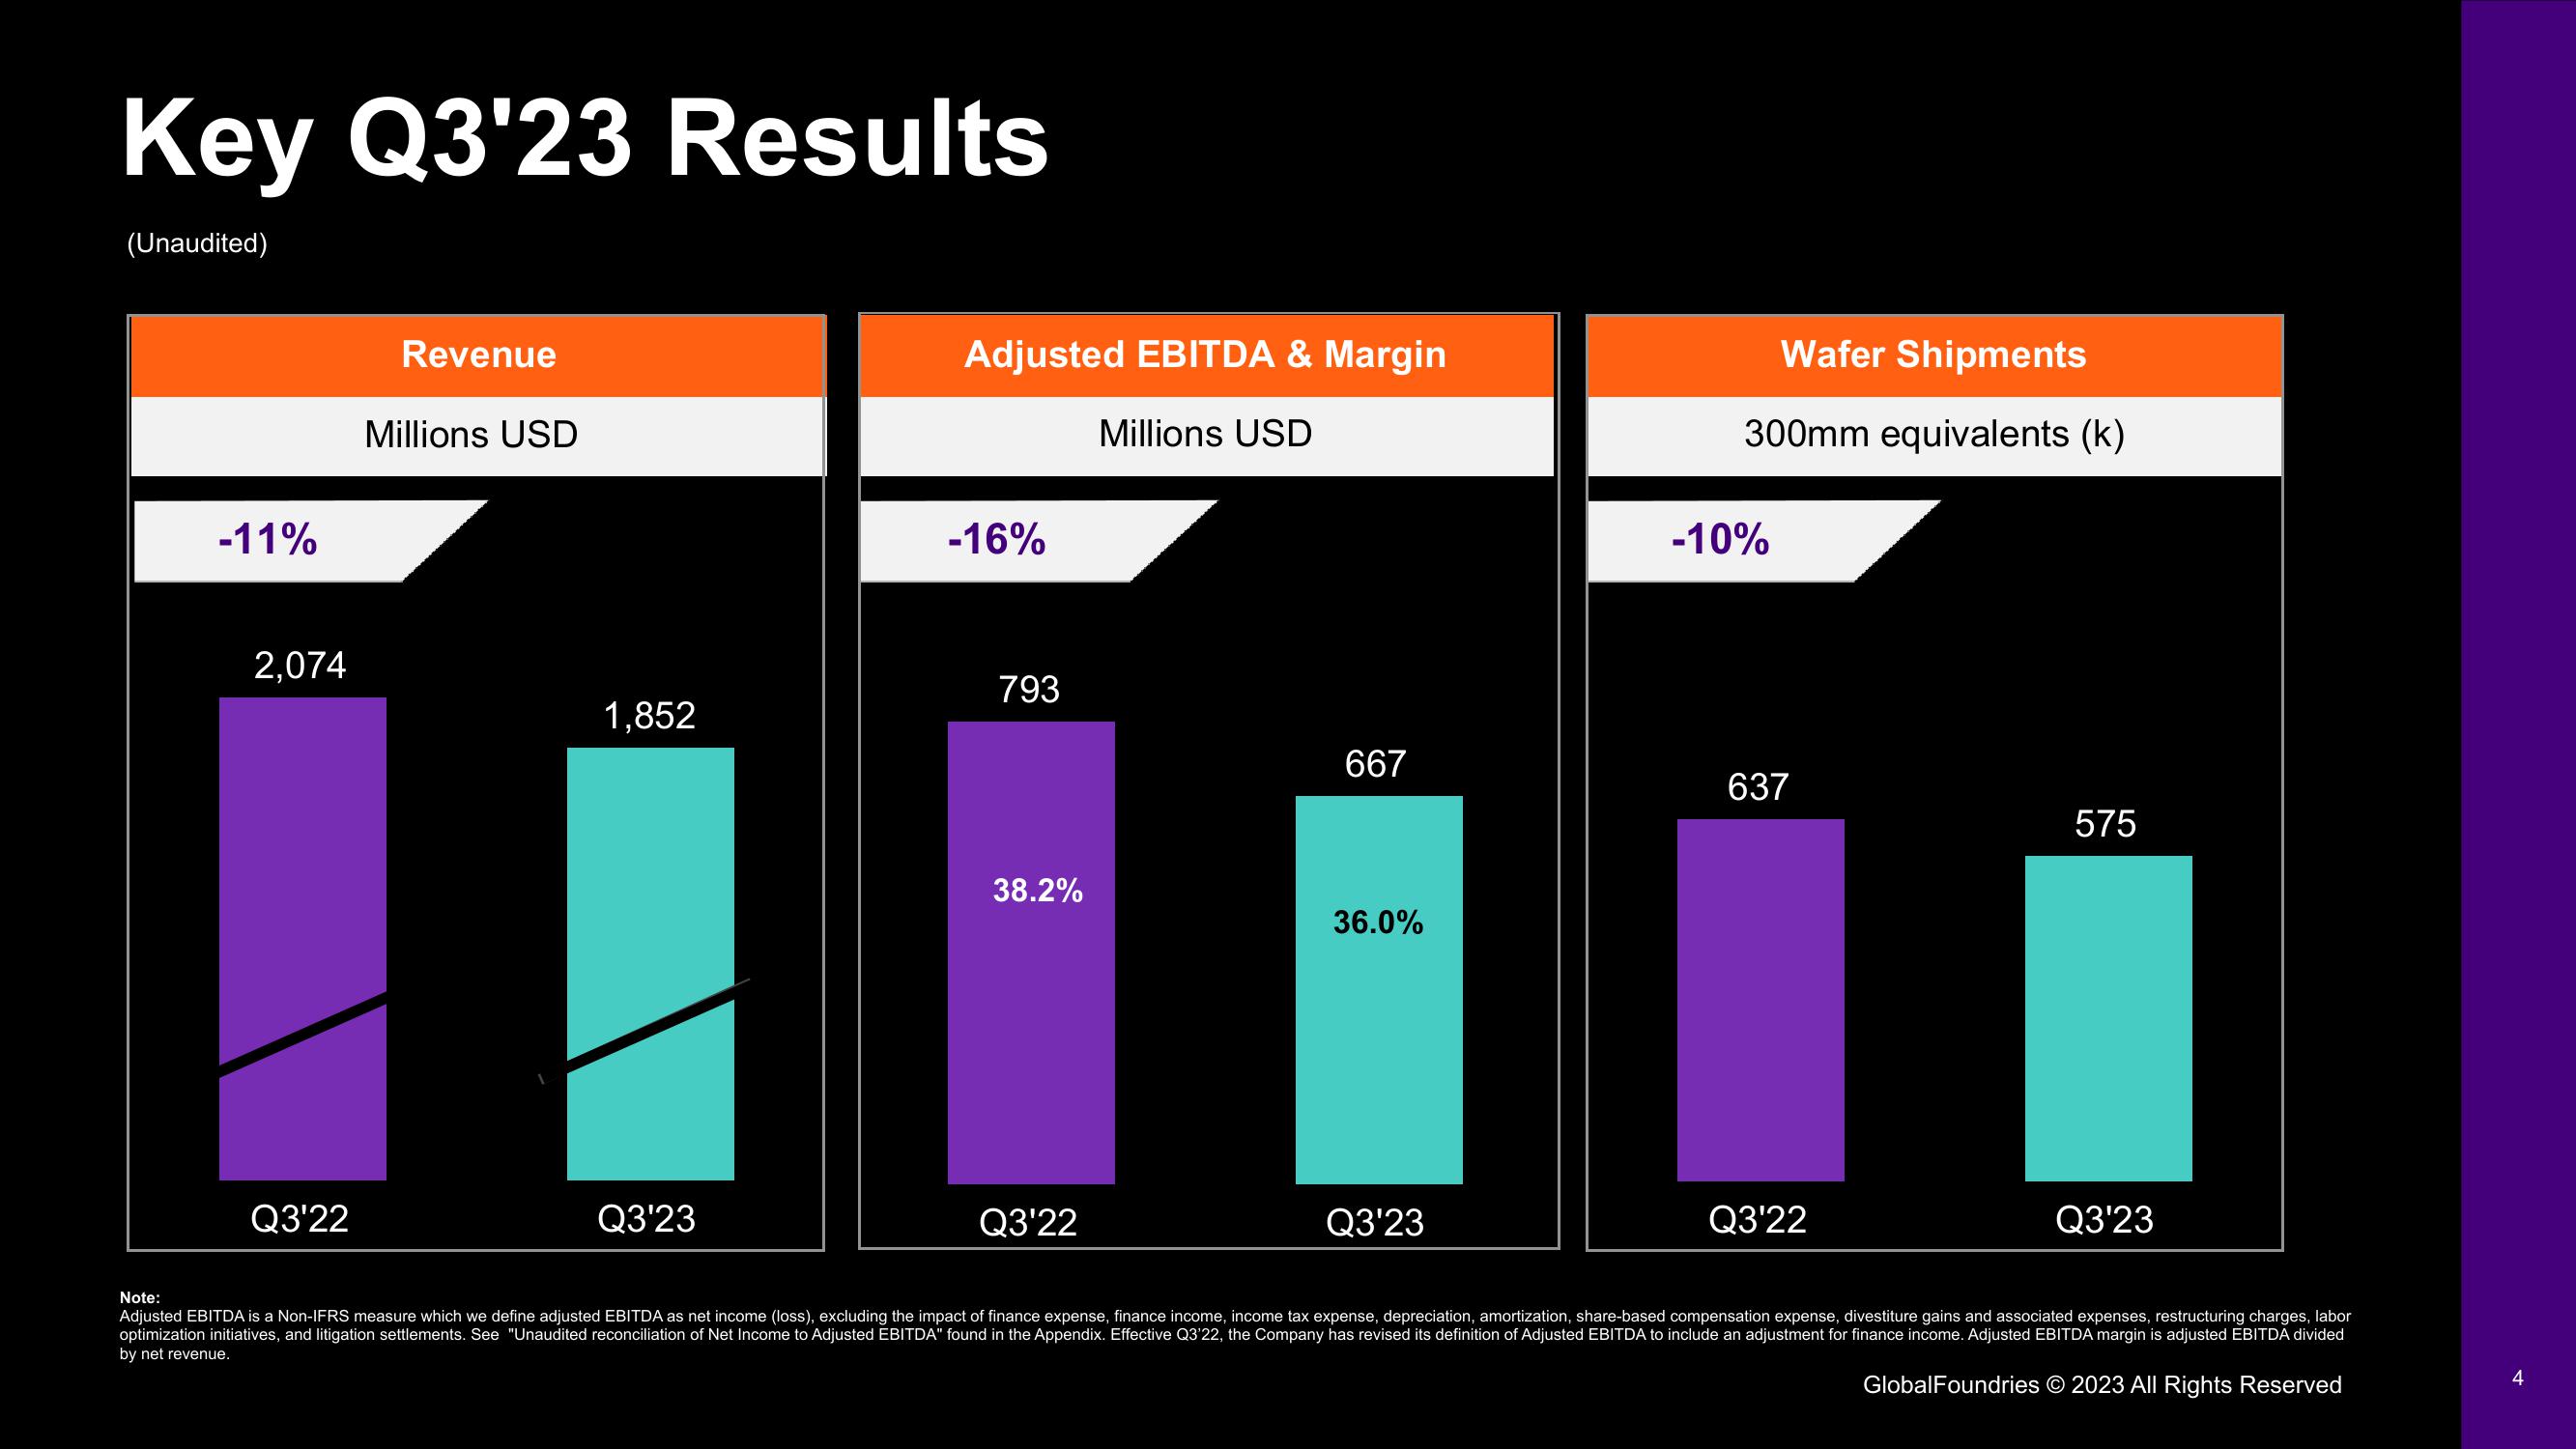
-11%
2,074
Q3'22
Revenue
Millions USD
1,852
Q3'23
Adjusted EBITDA & Margin
Millions USD
-16%
793
38.2%
Q3'22
667
36.0%
Q3'23
Wafer Shipments
300mm equivalents (k)
-10%
637
Q3'22
575
Q3'23
Note:
Adjusted EBITDA is a Non-IFRS measure which we define adjusted EBITDA as net income (loss), excluding the impact of finance expense, finance income, income tax expense, depreciation, amortization, share-based compensation expense, divestiture gains and associated expenses, restructuring charges, labor
optimization initiatives, and litigation settlements. See "Unaudited reconciliation of Net Income to Adjusted EBITDA" found in the Appendix. Effective Q3'22, the Company has revised its definition of Adjusted EBITDA to include an adjustment for finance income. Adjusted EBITDA margin is adjusted EBITDA divided
by net revenue.
GlobalFoundries © 2023 All Rights Reserved
4View entire presentation