Silicon Valley Bank Results Presentation Deck
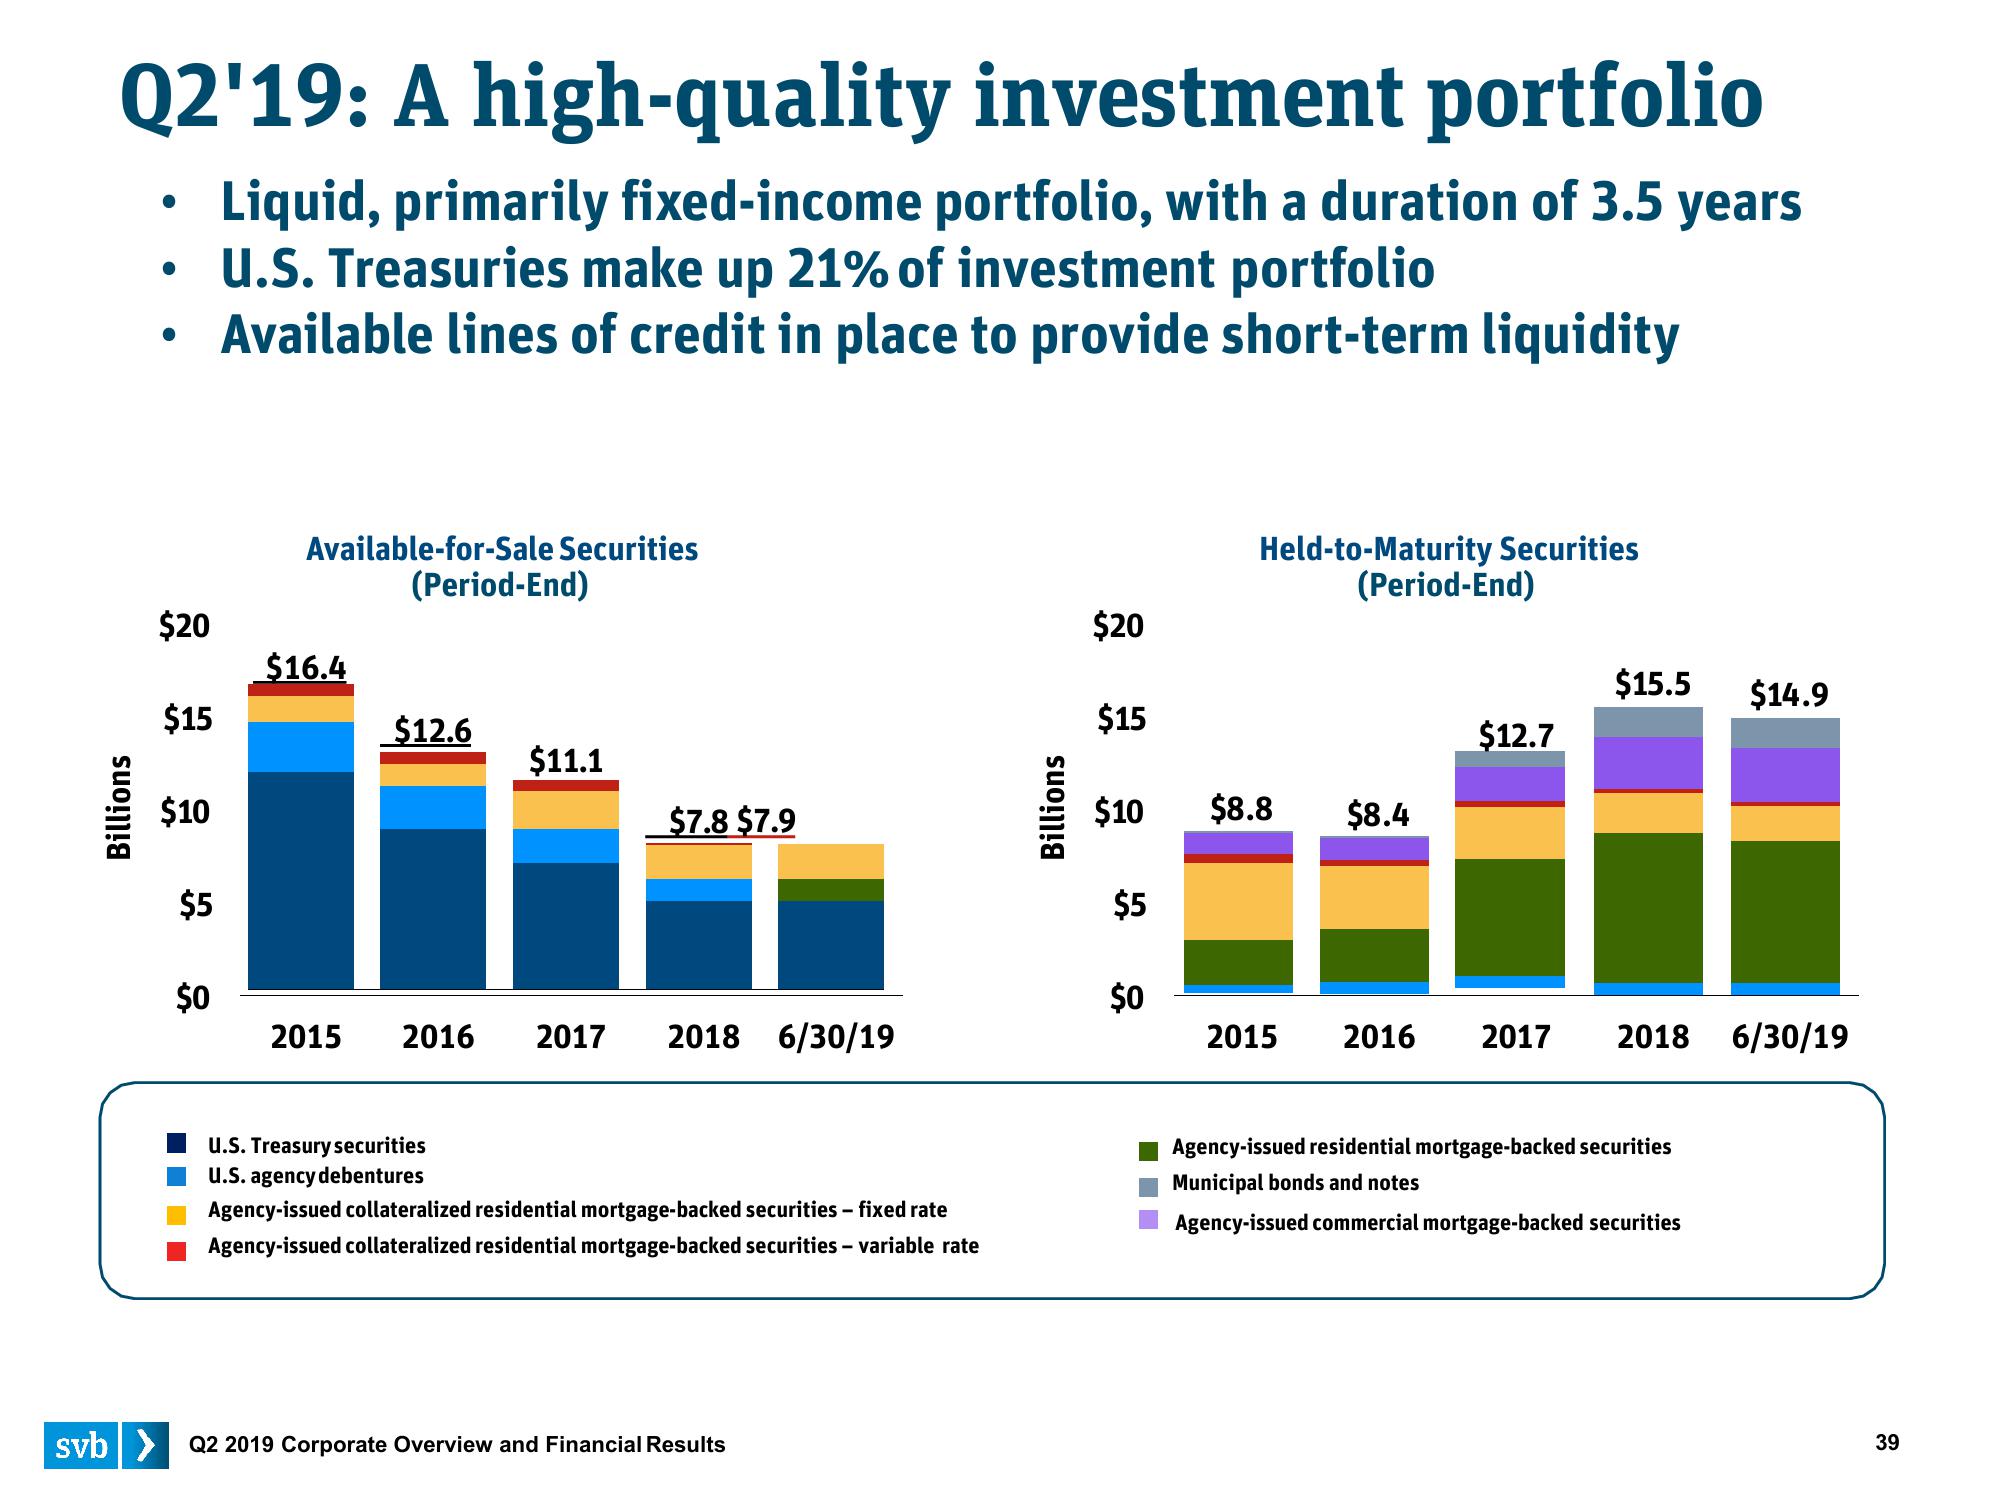
Q2'19: A high-quality investment portfolio
Liquid, primarily fixed-income portfolio, with a duration of 3.5 years
U.S. Treasuries make up 21% of investment portfolio
Available lines of credit in place to provide short-term liquidity
Billions
●
●
$20
$15
$10
$5
$0
Available-for-Sale Securities
(Period-End)
$16.4
2015
$12.6
$11.1
2016 2017
$7.8 $7.9
2018 6/30/19
U.S. Treasury securities
U.S. agency debentures
Agency-issued collateralized residential mortgage-backed securities - fixed rate
Agency-issued collateralized residential mortgage-backed securities - variable rate
svb> Q2 2019 Corporate Overview and Financial Results
Billions
$20
$15
$10
$5
$0
Held-to-Maturity Securities
(Period-End)
$8.8 $8.4
$12.7
$15.5 $14.9
2015 2016 2017 2018 6/30/19
Agency-issued residential mortgage-backed securities
Municipal bonds and notes
Agency-issued commercial mortgage-backed securities
39View entire presentation