MoneyLion Results Presentation Deck
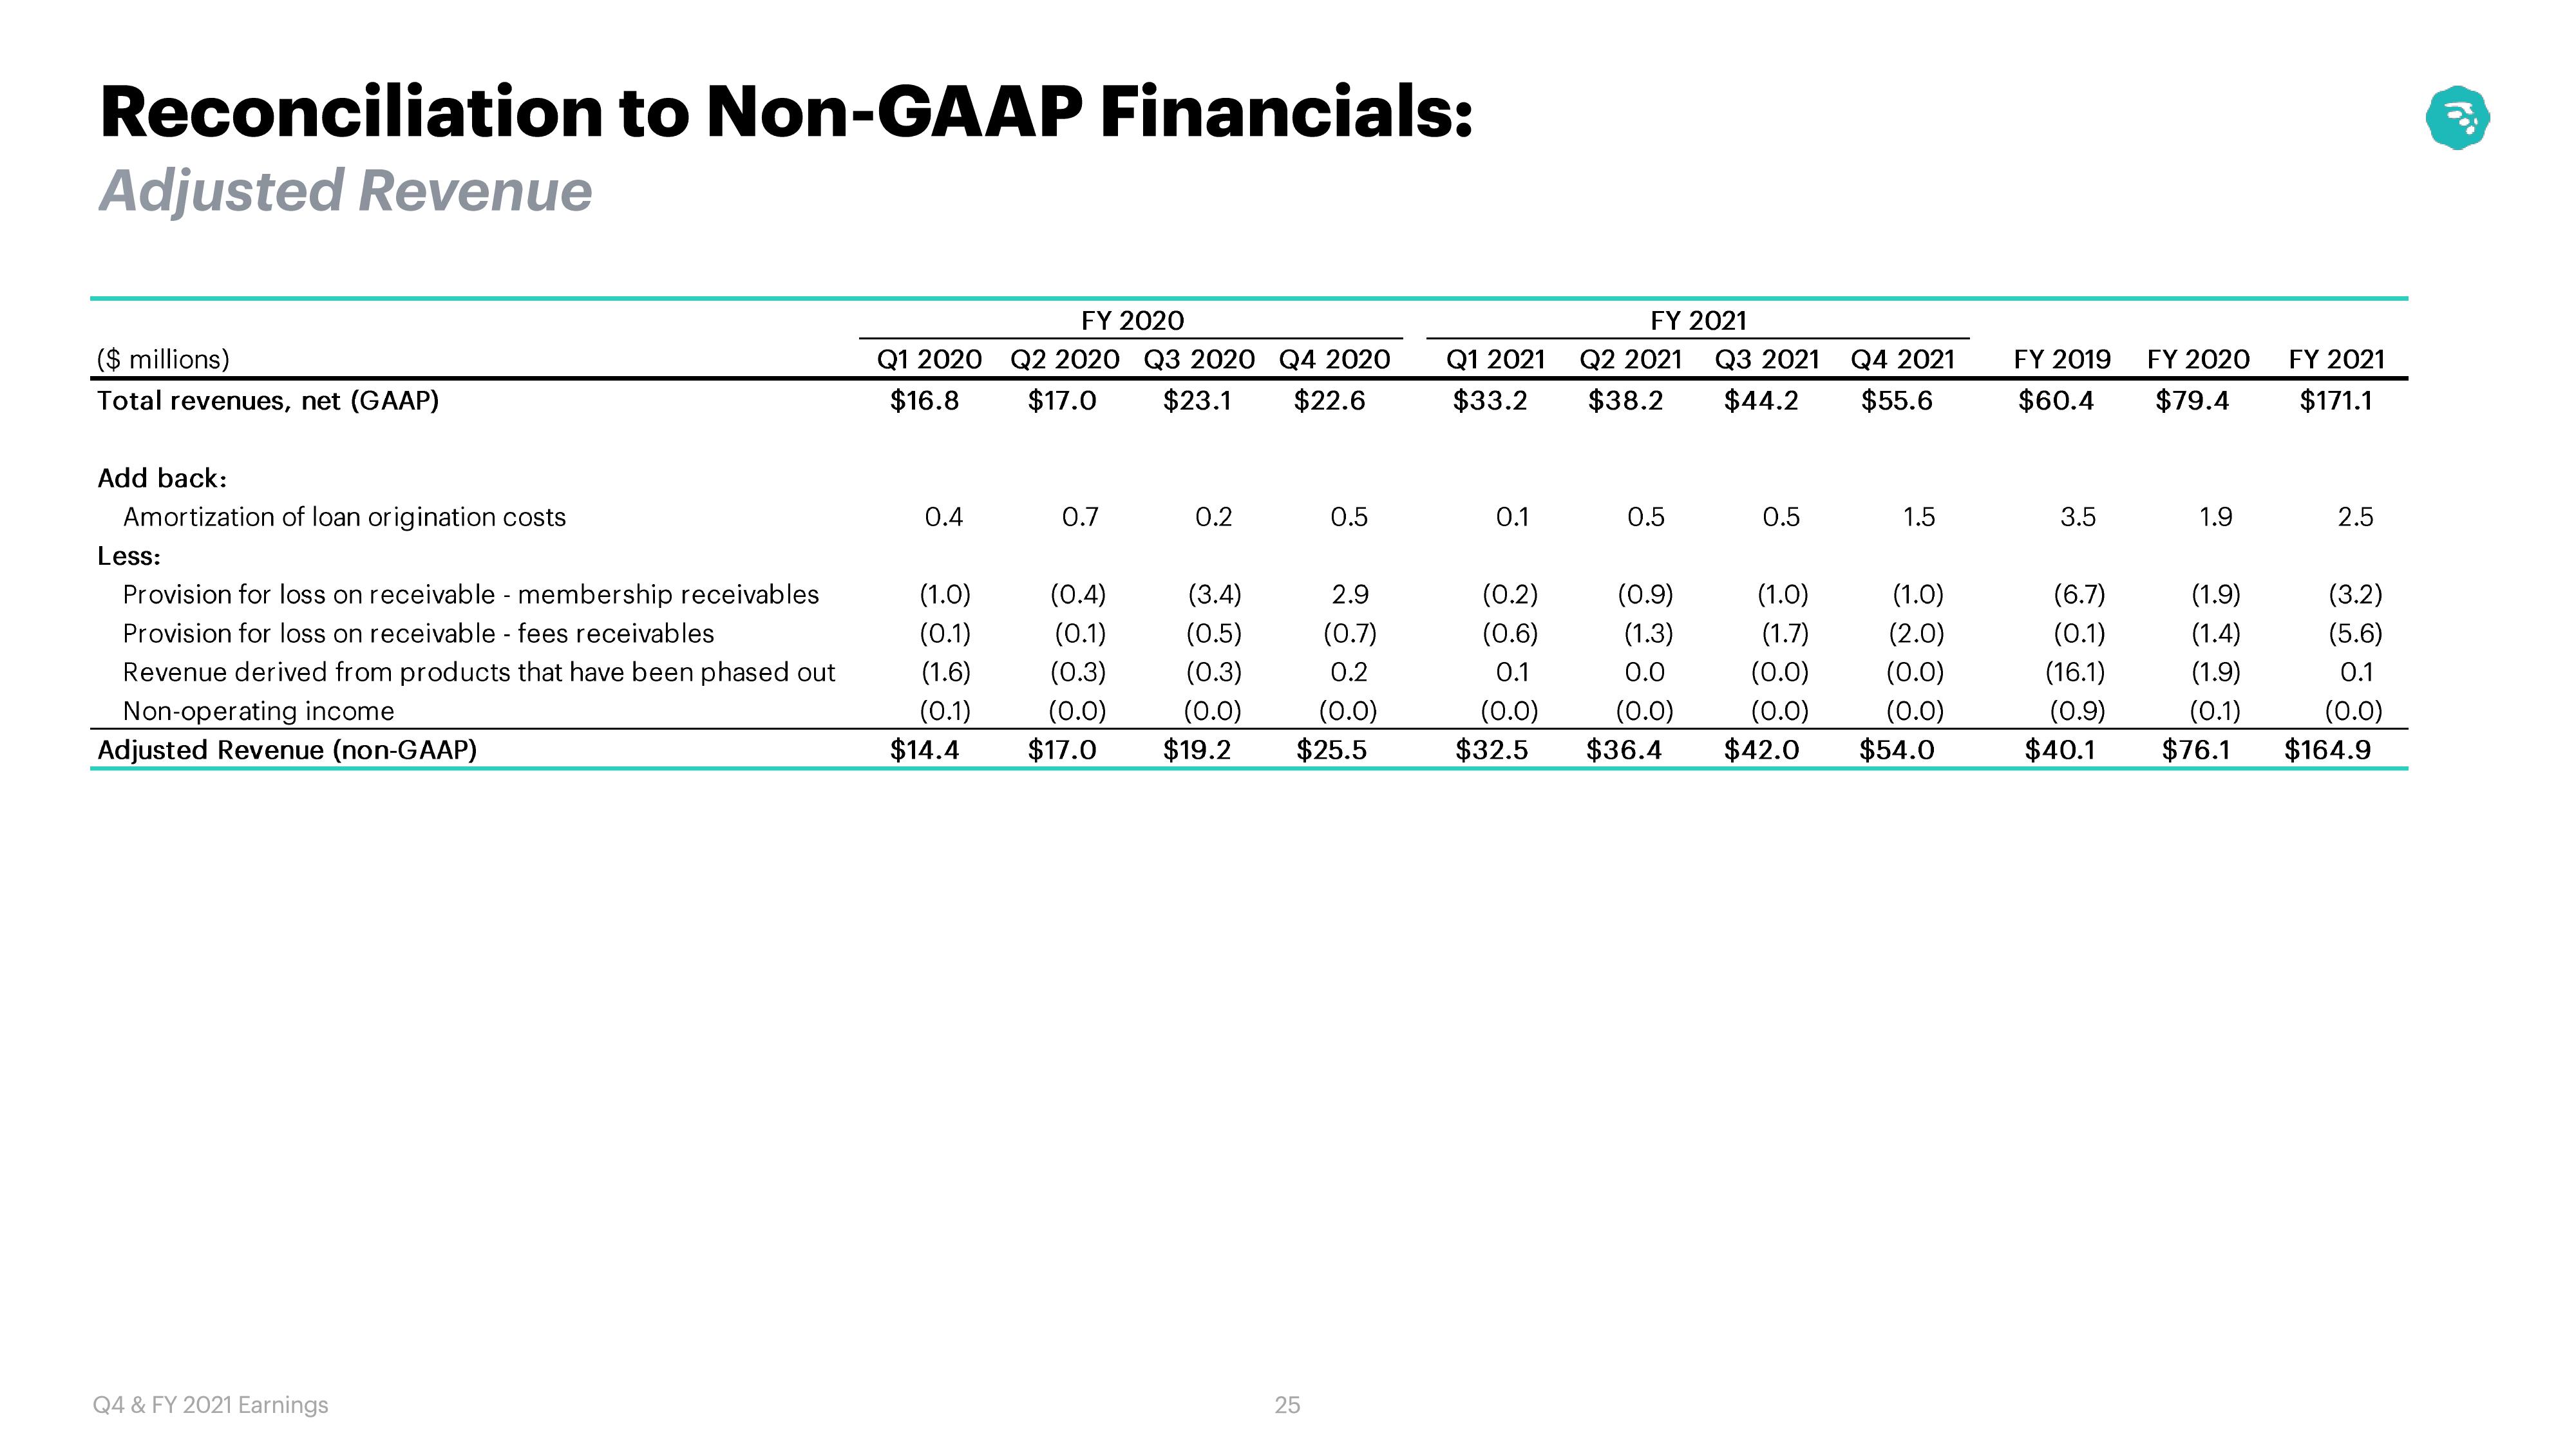
Reconciliation to Non-GAAP Financials:
Adjusted Revenue
($ millions)
Total revenues, net (GAAP)
Add back:
Amortization of loan origination costs
Less:
Provision for loss receivable membership receivables
Provision for loss on receivable - fees receivables
Revenue derived from products that have been phased out
Non-operating income
Adjusted Revenue (non-GAAP)
Q4 & FY 2021 Earnings
Q1 2020
$16.8
0.4
(1.0)
(0.1)
(1.6)
(0.1)
$14.4
FY 2020
Q2 2020 Q3 2020 Q4 2020
$17.0 $23.1 $22.6
0.7
(0.4)
(0.1)
(0.3)
(0.0)
$17.0
0.2
0.5
(3.4)
2.9
(0.5)
(0.7)
(0.3)
0.2
(0.0)
(0.0)
$19.2 $25.5
25
FY 2021
Q1 2021 Q2 2021
$33.2 $38.2
0.1
0.5
Q3 2021
$44.2
0.5
Q4 2021
$55.6
(1.0)
(1.7)
1.5
(0.2)
(0.9)
(1.0)
(0.6)
(1.3)
(2.0)
0.1
0.0
(0.0)
(0.0)
(0.0)
(0.0)
(0.0)
(0.0)
$32.5 $36.4 $42.0 $54.0
FY 2019
$60.4
3.5
(0.1)
(16.1)
(0.9)
$40.1
FY 2020
$79.4
1.9
(1.9)
(1.4)
(1.9)
(0.1)
$76.1
FY 2021
$171.1
2.5
(3.2)
(5.6)
0.1
(0.0)
$164.9View entire presentation