Melrose Results Presentation Deck
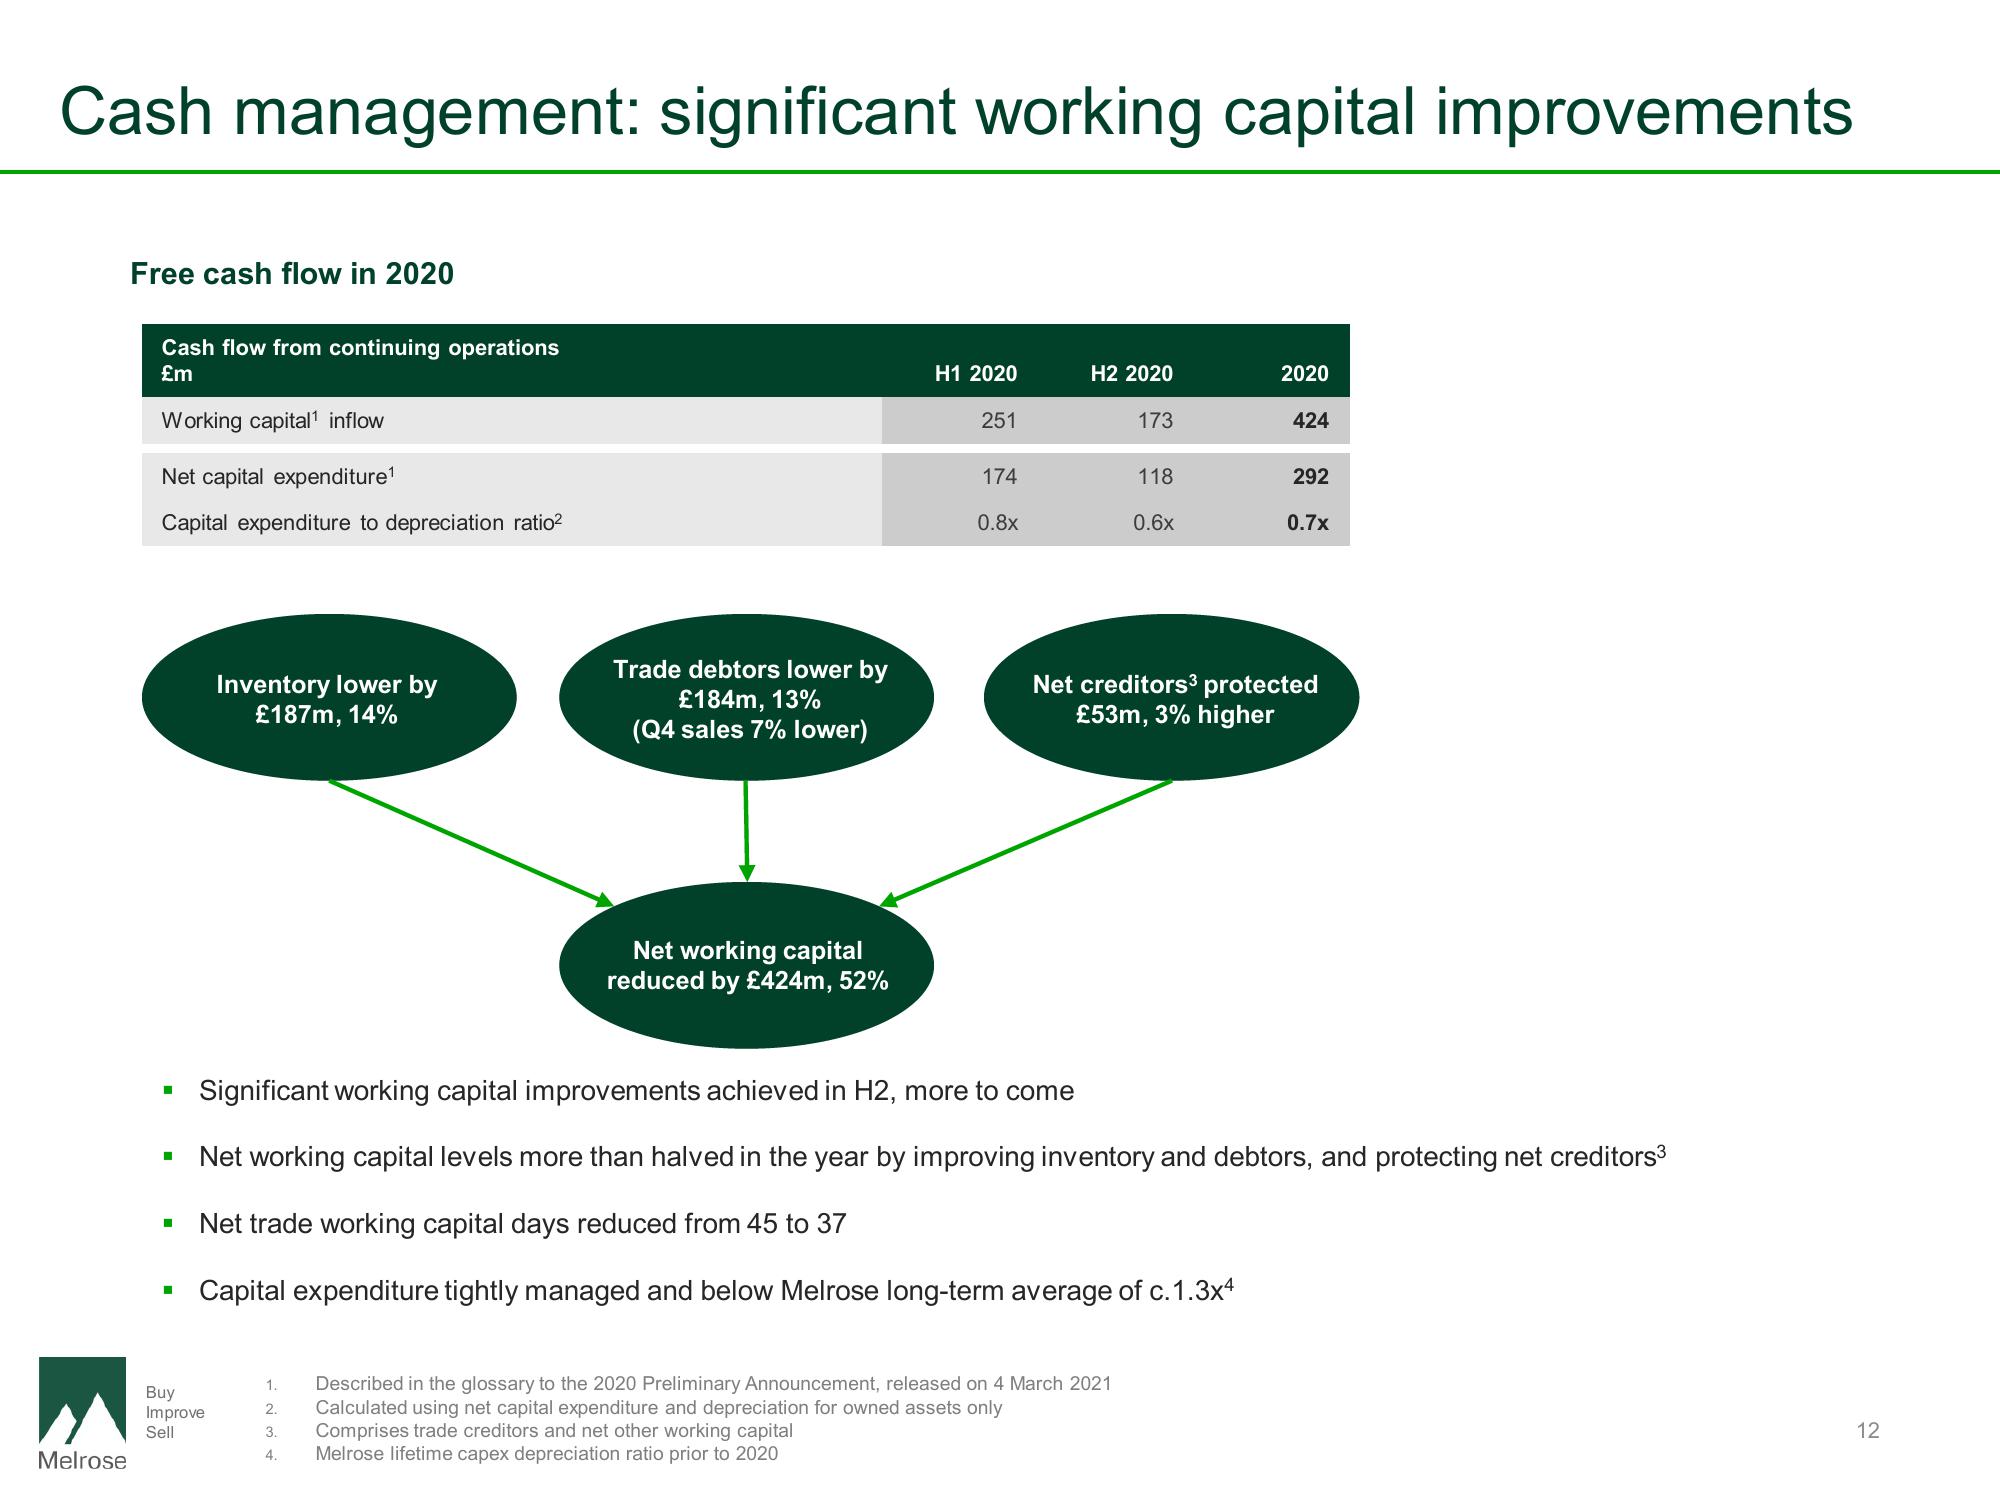
Cash management: significant working capital improvements
Melrose
Free cash flow in 2020
Cash flow from continuing operations
£m
Working capital¹ inflow
Net capital expenditure¹
Capital expenditure to depreciation ratio²
I
■
■
Inventory lower by
£187m, 14%
Buy
Improve
Sell
Trade debtors lower by
£184m, 13%
(Q4 sales 7% lower)
Net working capital
reduced by £424m, 52%
H1 2020
251
174
0.8x
1.
2.
3. Comprises trade creditors and net other working capital
4.
Melrose lifetime capex depreciation ratio prior to 2020
H2 2020
173
Described in the glossary to the 2020 Preliminary Announcement, released on 4 March 2021
Calculated using net capital expenditure and depreciation for owned assets only
118
0.6x
2020
424
Significant working capital improvements achieved in H2, more to come
Net working capital levels more than halved in the year by improving inventory and debtors, and protecting net creditors³
Net trade working capital days reduced from 45 to 37
Capital expenditure tightly managed and below Melrose long-term average of c.1.3x4
292
0.7x
Net creditors³ protected
£53m, 3% higher
12View entire presentation