Benson Hill Results Presentation Deck
Modified 2023 Guidance
(USD in millions)
Excludes Fresh Business¹
Consolidated Revenue
Proprietary
Consolidated Gross Profit
Operating Expense w/o Adj.
Non-Cash stock-based Comp
Goodwill Impairment
Operating Expense
Net Loss from Continuing Operations (Not
of Income Tax)²
Total Adjusted EBITDA³
Capital Expenditures
Free Cash Flow Loss²
2023 Guidance
Revised
$390 - $430
$100-$110
$20-$25
$110-$115
$(7)
$19
$122 - $127
$(127) - $(137)
$(53) - $(58)
$15 - $20
$(110) - $(118)
Prior
$390-$430
$100-$110
$20-$30
$115 - $120
$115 - $120
$(115) - $(125)
$(53) - $(58)
$20-$25
$(110) - $(118)
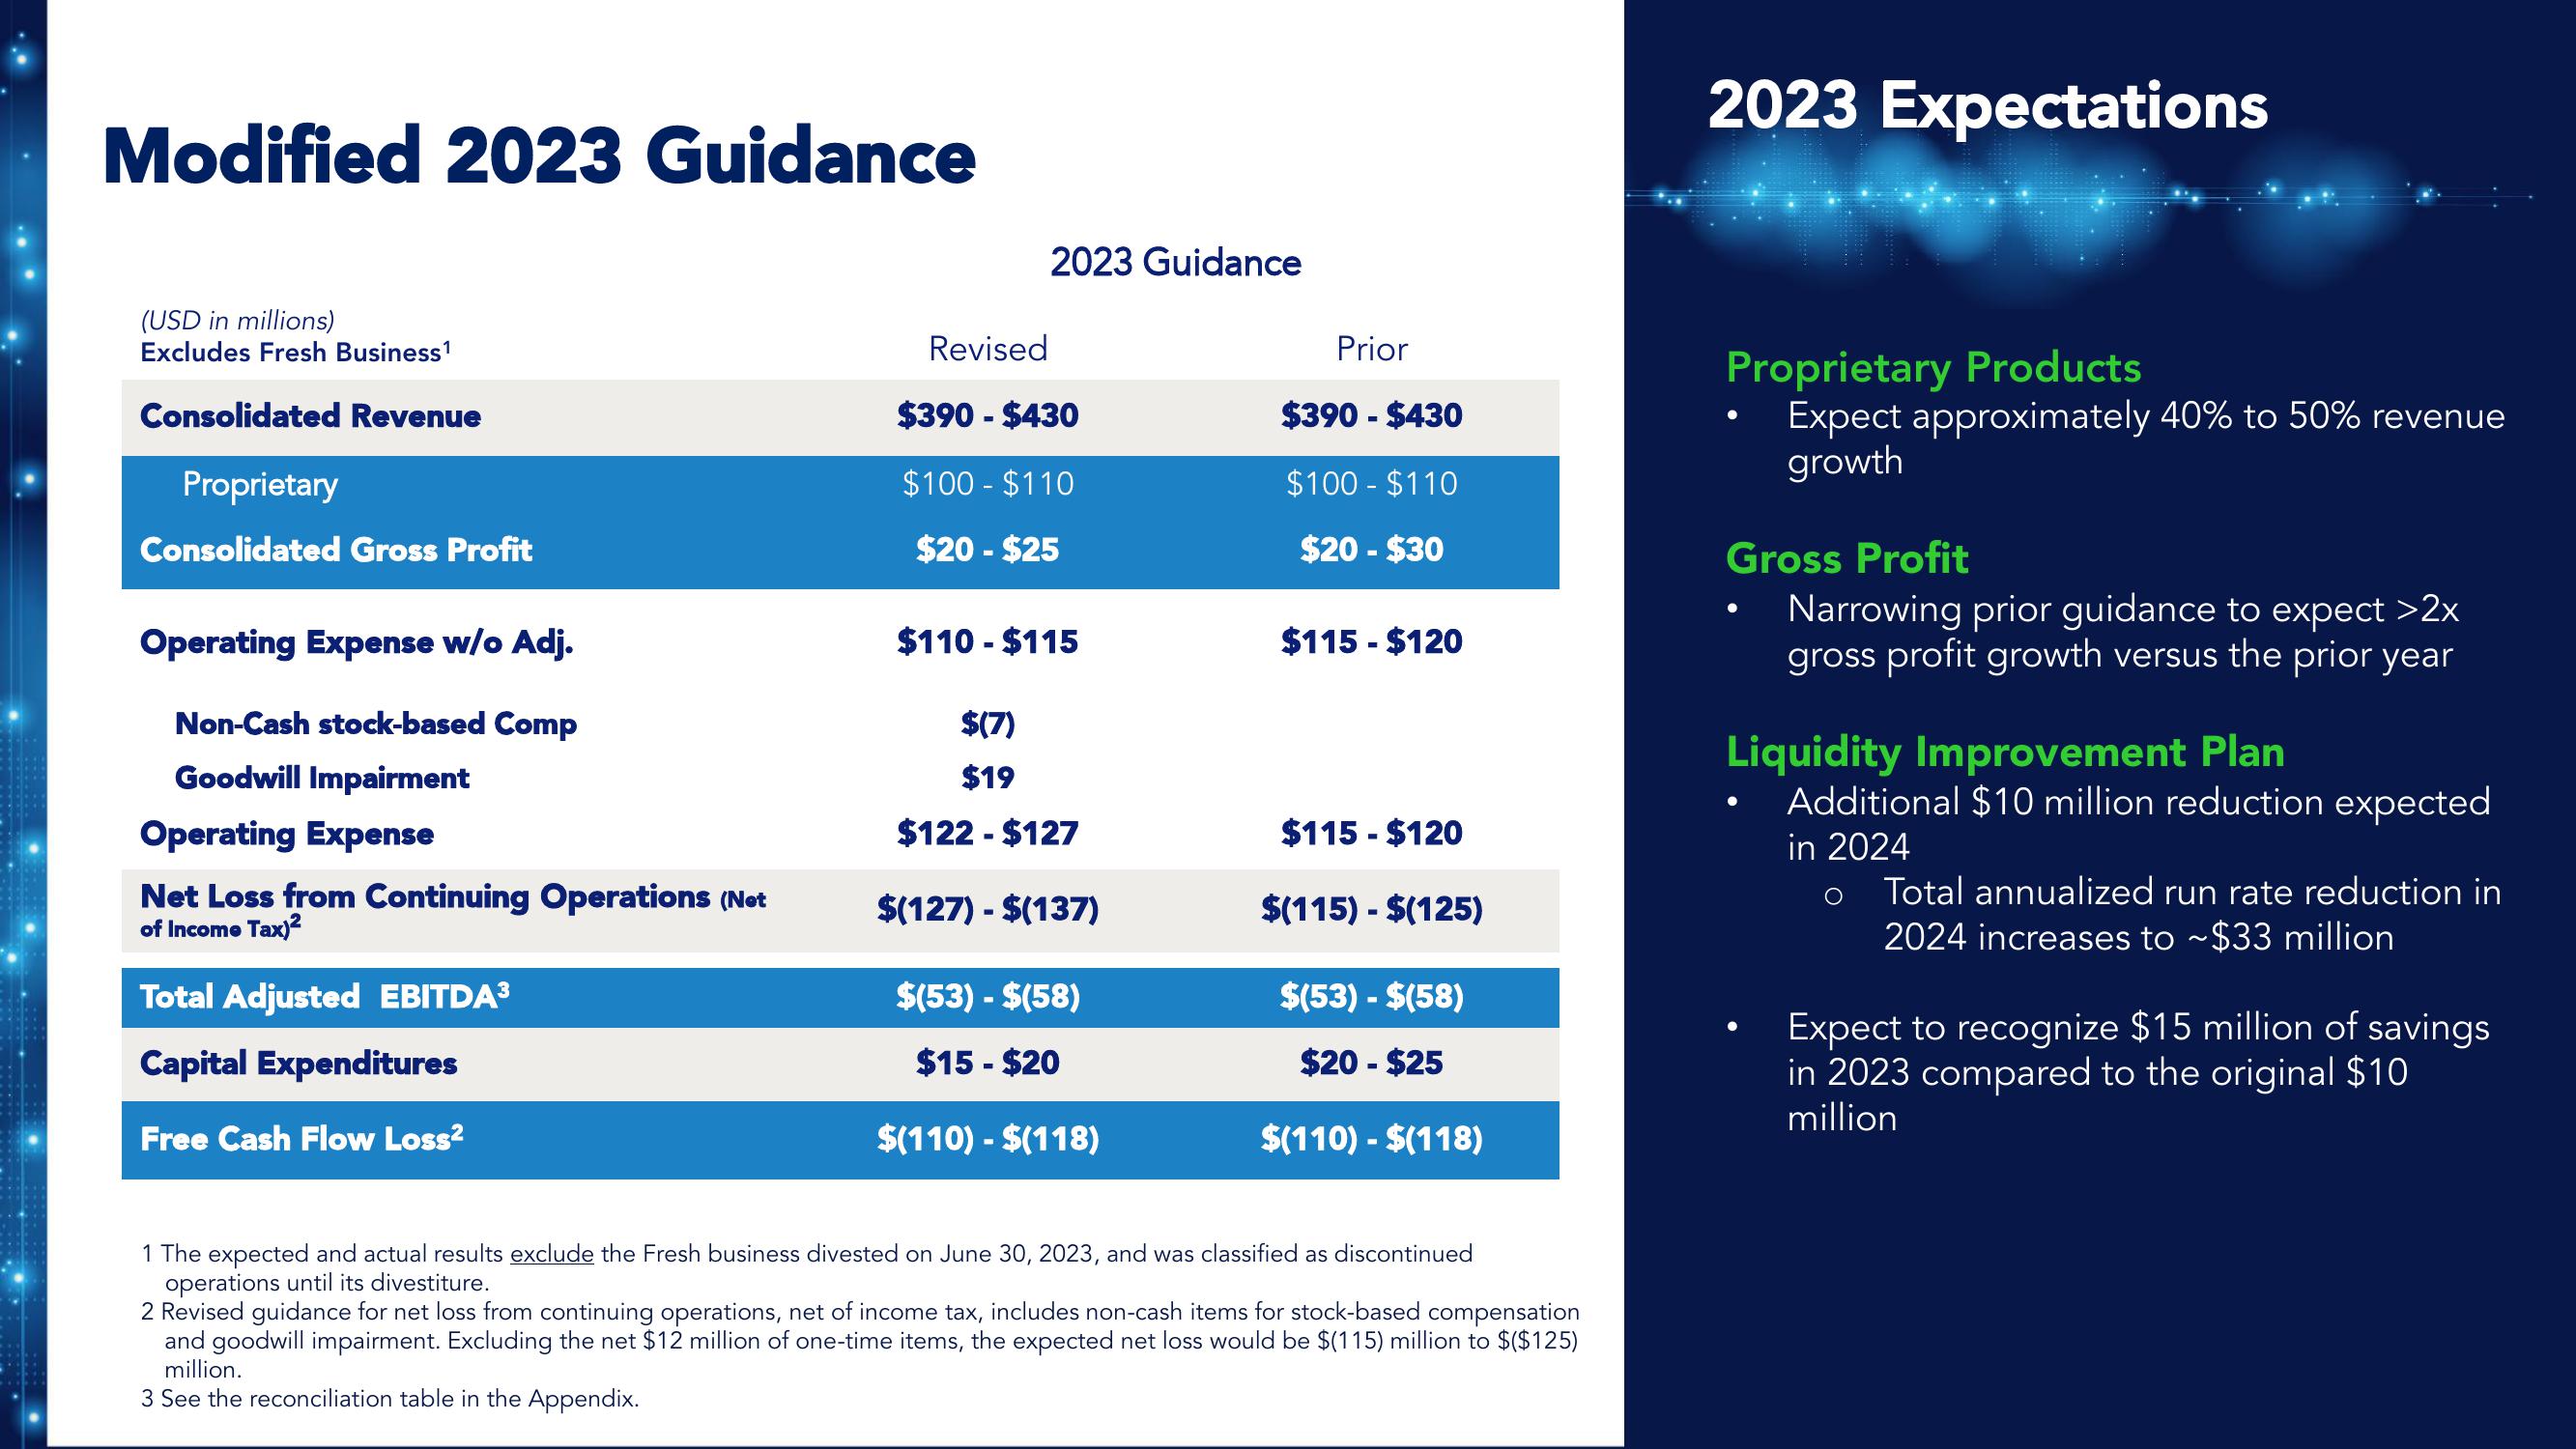
1 The expected and actual results exclude the Fresh business divested on June 30, 2023, and was classified as discontinued
operations until its divestiture.
2 Revised guidance for net loss from continuing operations, net of income tax, includes non-cash items for stock-based compensation
and goodwill impairment. Excluding the net $12 million of one-time items, the expected net loss would be $(115) million to $($125)
million.
3 See the reconciliation table in the Appendix.
2023 Expectations
Proprietary Products
Expect approximately 40% to 50% revenue
growth
Gross Profit
Narrowing prior guidance to expect >2x
gross profit growth versus the prior year
Liquidity Improvement Plan
Additional $10 million reduction expected
in 2024
Total annualized run rate reduction in
2024 increases to ~$33 million
Expect to recognize $15 million of savings
in 2023 compared to the original $10
millionView entire presentation