Topps SPAC Presentation Deck
24
2
11.2%
3
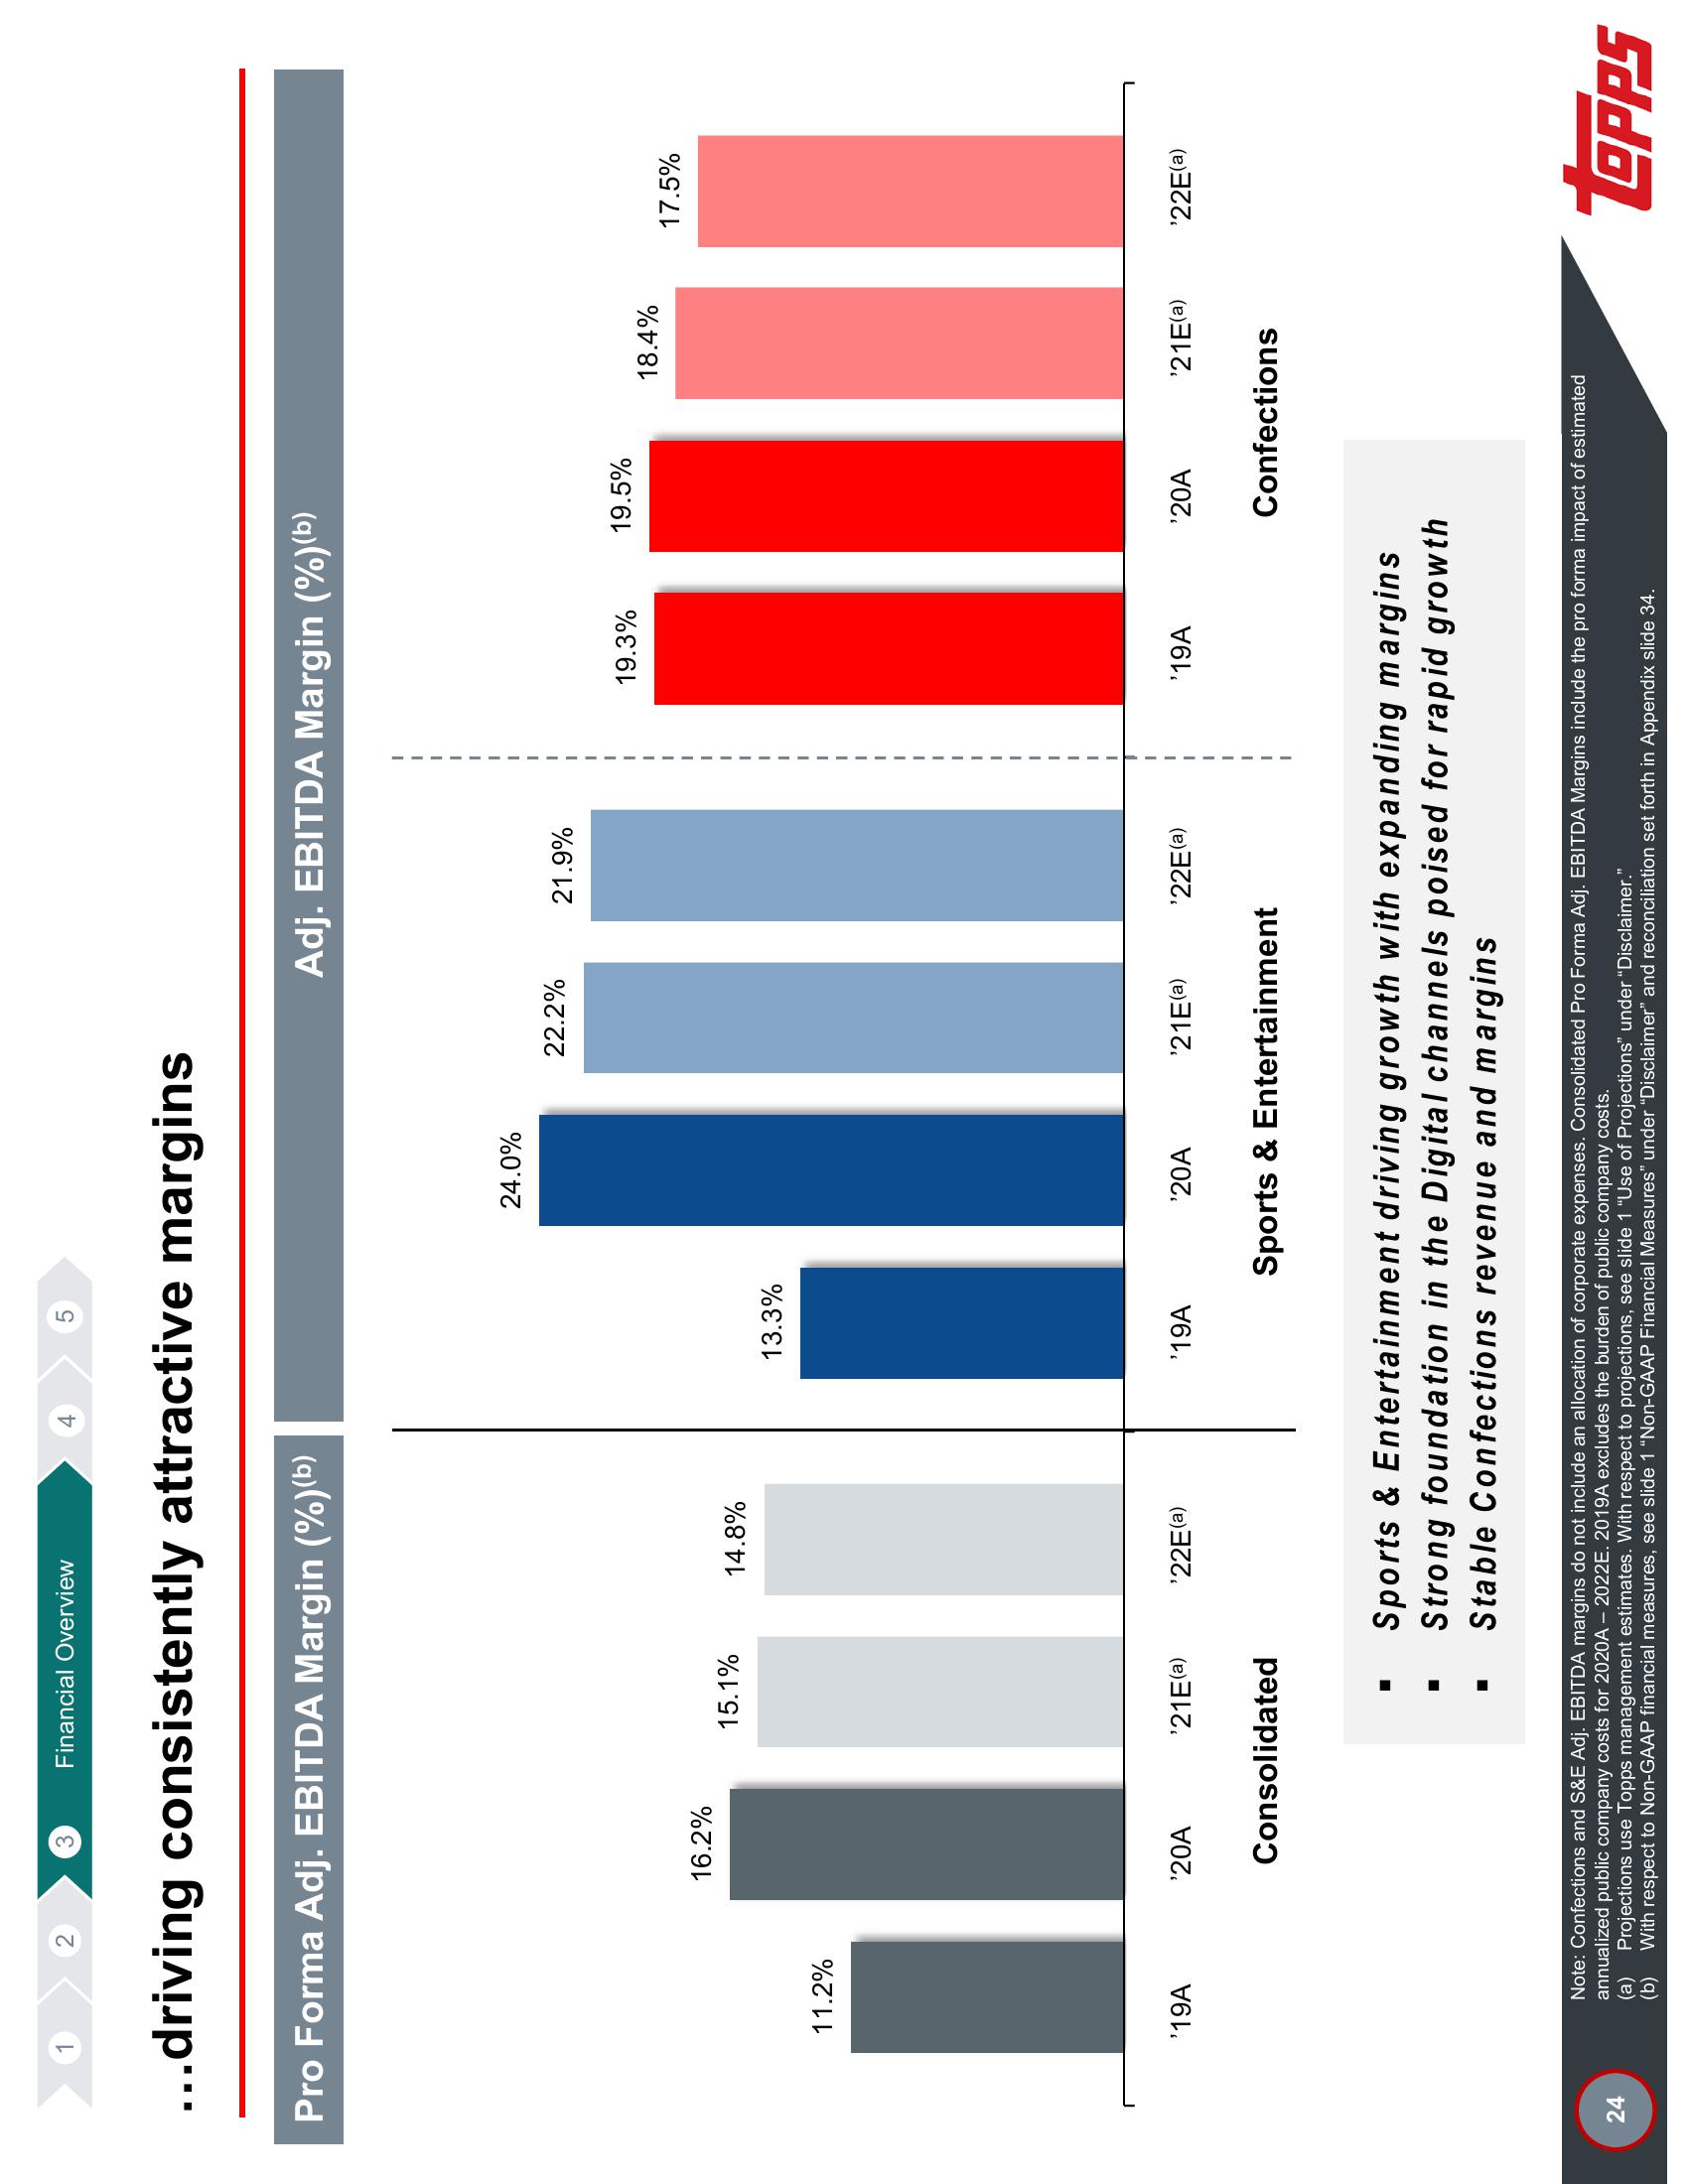
Pro Forma Adj. EBITDA Margin (%)(b)
¹19A
...driving consistently attractive margins
Financial Overview
16.2%
'20A
15.1%
'21E(a)
Consolidated
■
I
■
14.8%
4
'22E(a)
5
13.3%
'19A
24.0%
¹20A
22.2%
Adj. EBITDA Margin (%)(b)
'21E(a)
Sports & Entertainment
21.9%
'22E(a)
1
19.3%
¹19A
19.5%
'20A
18.4%
Sports & Entertainment driving growth with expanding margins
Strong foundation in the Digital channels poised for rapid growth
Stable Confections revenue and margins
'21E(a)
Confections
Note: Confections and S&E Adj. EBITDA margins do not include an allocation of corporate expenses. Consolidated Pro Forma Adj. EBITDA Margins include the pro forma impact of estimated
annualized public company costs for 2020A-2022E. 2019A excludes the burden of public company costs.
(a) Projections use Topps management estimates. With respect to projections, see slide 1 "Use of Projections" under "Disclaimer."
(b)
With respect to Non-GAAP financial measures, see slide 1 "Non-GAAP Financial Measures" under "Disclaimer" and reconciliation set forth in Appendix slide 34.
17.5%
'22E(a)
LOPPSView entire presentation