Uber Results Presentation Deck
Mobility Highlights
$ in Millions
Gross
Bookings
% Constant Currency
Growth YoY
Revenue
% Constant Currency
Growth YoY
Adjusted
EBITDA
Uber
Q2 2021 Earnings
$3,046
(73%)
25.9%
O
$788
(69%)*
6.3%
O
$5,905
(50%)
23.1%
$1,364
(51%)
18.0%
$245
$6,789
(47%)
21.7%
$1,471
(51%)
19.9%
$293
$6,773
(36%)
21.5%**
12.6%
i $1,453** i
$853
(63%)
34.9%
20.5%
$298
$8,640
174%
18.7%
$1,617
98%
11.1%
$179
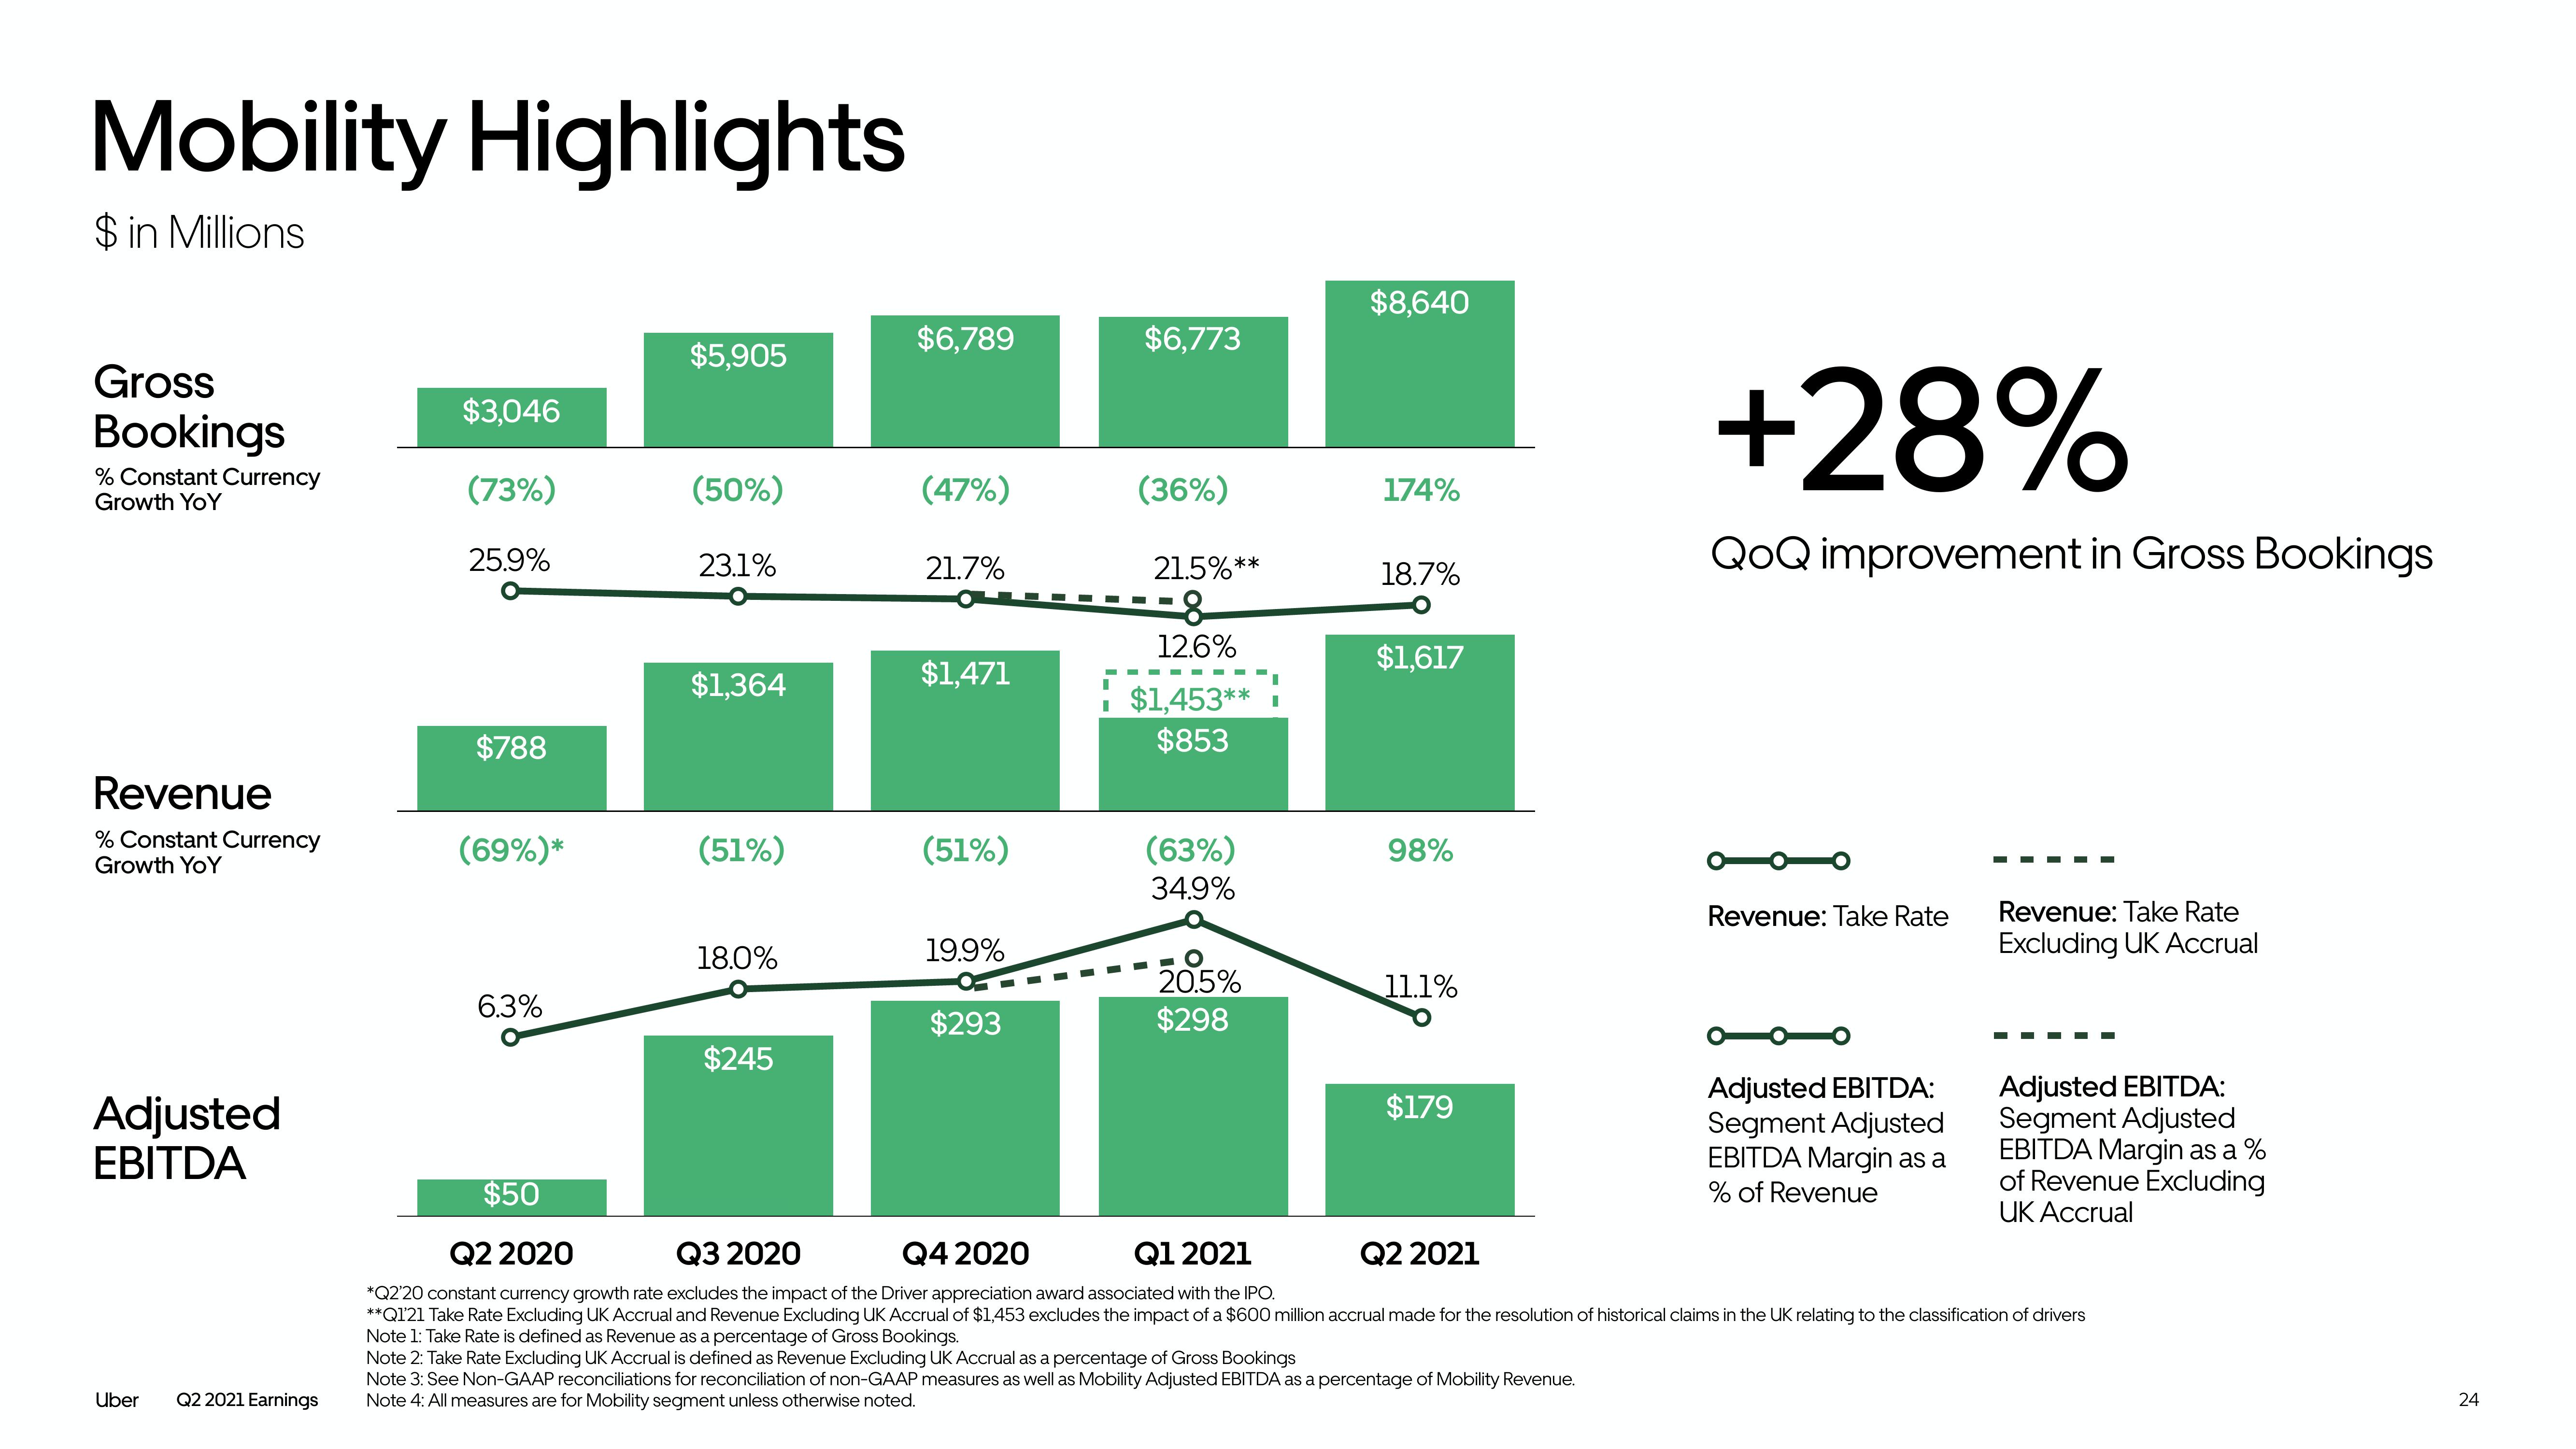
+28%
QoQ improvement in Gross Bookings
Note 3: See Non-GAAP reconciliations for reconciliation of non-GAAP measures as well as Mobility Adjusted EBITDA as a percentage of Mobility Revenue.
Note 4: All measures are for Mobility segment unless otherwise noted.
Revenue: Take Rate
Adjusted EBITDA:
Segment Adjusted
EBITDA Margin as a
% of Revenue
Revenue: Take Rate
Excluding UK Accrual
Adjusted EBITDA:
Segment Adjusted
EBITDA Margin as a %
of Revenue Excluding
UK Accrual
$50
Q2 2020
Q3 2020
Q4 2020
Q1 2021
Q2 2021
*Q2'20 constant currency growth rate excludes the impact of the Driver appreciation award associated with the IPO.
**Q1'21 Take Rate Excluding UK Accrual and Revenue Excluding UK Accrual of $1,453 excludes the impact of a $600 million accrual made for the resolution of historical claims in the UK relating to the classification of drivers
Note 1: Take Rate is defined as Revenue as a percentage of Gross Bookings.
Note 2: Take Rate Excluding
Accrual is defined as Revenue Excluding UK Accrual as a percentage of Gross Bookings
24View entire presentation