Bridge Investment Group Results Presentation Deck
NON-GAAP FINANCIAL MEASURES
Year Ended
December 31,
2021
Pro Forma
($ in thousands)
Fund-level fee revenues
Fund management fees
Transaction fees
Total net fund-level fee revenues
Net earnings from Bridge property operators
Development fees
Fund administration fees
Other asset management and property income
Fee Related Revenues
Cash-based employee compensation and benefits
Net administrative expenses
Fee Related Expenses
Total Fee Related Earnings
Less: Total Fee Related Earnings attributable to
non-controlling interests
Total Fee Related Earnings to the Operating
Company
Fund level performance fee revenues
Realized performance allocations and incentive
fees
Realized performance allocations and incentive
fees compensation
Net realized performance allocations attributable
to non-controlling interests
Net insurance income (loss)
Earnings (losses) from investments in real estate'
Net interest income (expense) and realized gain
(loss)
Distributable Earnings attributable to the
Operating Company
Three Months Ended
December 31,
2021
Distributable After-Tax Earnings per share of Class
A common stock - Basic and Diluted
$
BRIDGE INVESTMENT GROUP
2022
$ 55,408
5,033
60,441
4,164
1,651
3,925
2,475
72,656
(29,351)
(7,968)
(37,319)
35,337
(4,424)
30,913
4,455
(349)
(2,357)
3,083
60
(168)
$ 35,637
0.21
$ 49,965
31,598
81,563
2,469
1,136
2,649
87,817
(31,228)
(6,507)
(37,735)
50,082
(14,568)
35,514
10,345
(648)
(5,913)
(124)
333
(848)
$ 38,659
$ 0.26
YOY %
growth
Weighted-average shares of Class A common
stock outstanding - Basic and Diluted
24,373,172 22,742,137
Earnings from investments in real estate is offset by interest expense related to GP Lenders.
(26
(17)%
(29)%
2022
$221,584
56,205
277,789
10,504
4,688
15,031
11,502
7,313
319,514
253,553
(126,252)
(96,113)
(28,334) (16,971)
(154,586) (113,084)
140,469
164,928
(6,603)
(13)% 158,325
$ 155,945
75,073
231,018
11,519
3,703
(57)% 69,280
(4,396)
(39,320)
6,336
2,169
(4,472)
(8) % $187,922
(35,199)
105,270
83,439
(5,155)
(48,133)
1,976
2,092
(4,853)
$ 134,636
$ 1.10 $ 0.89
23,928,408 22,515,868
YOY %
growth
20%
26%
17%
50 %
(17)%
40 %
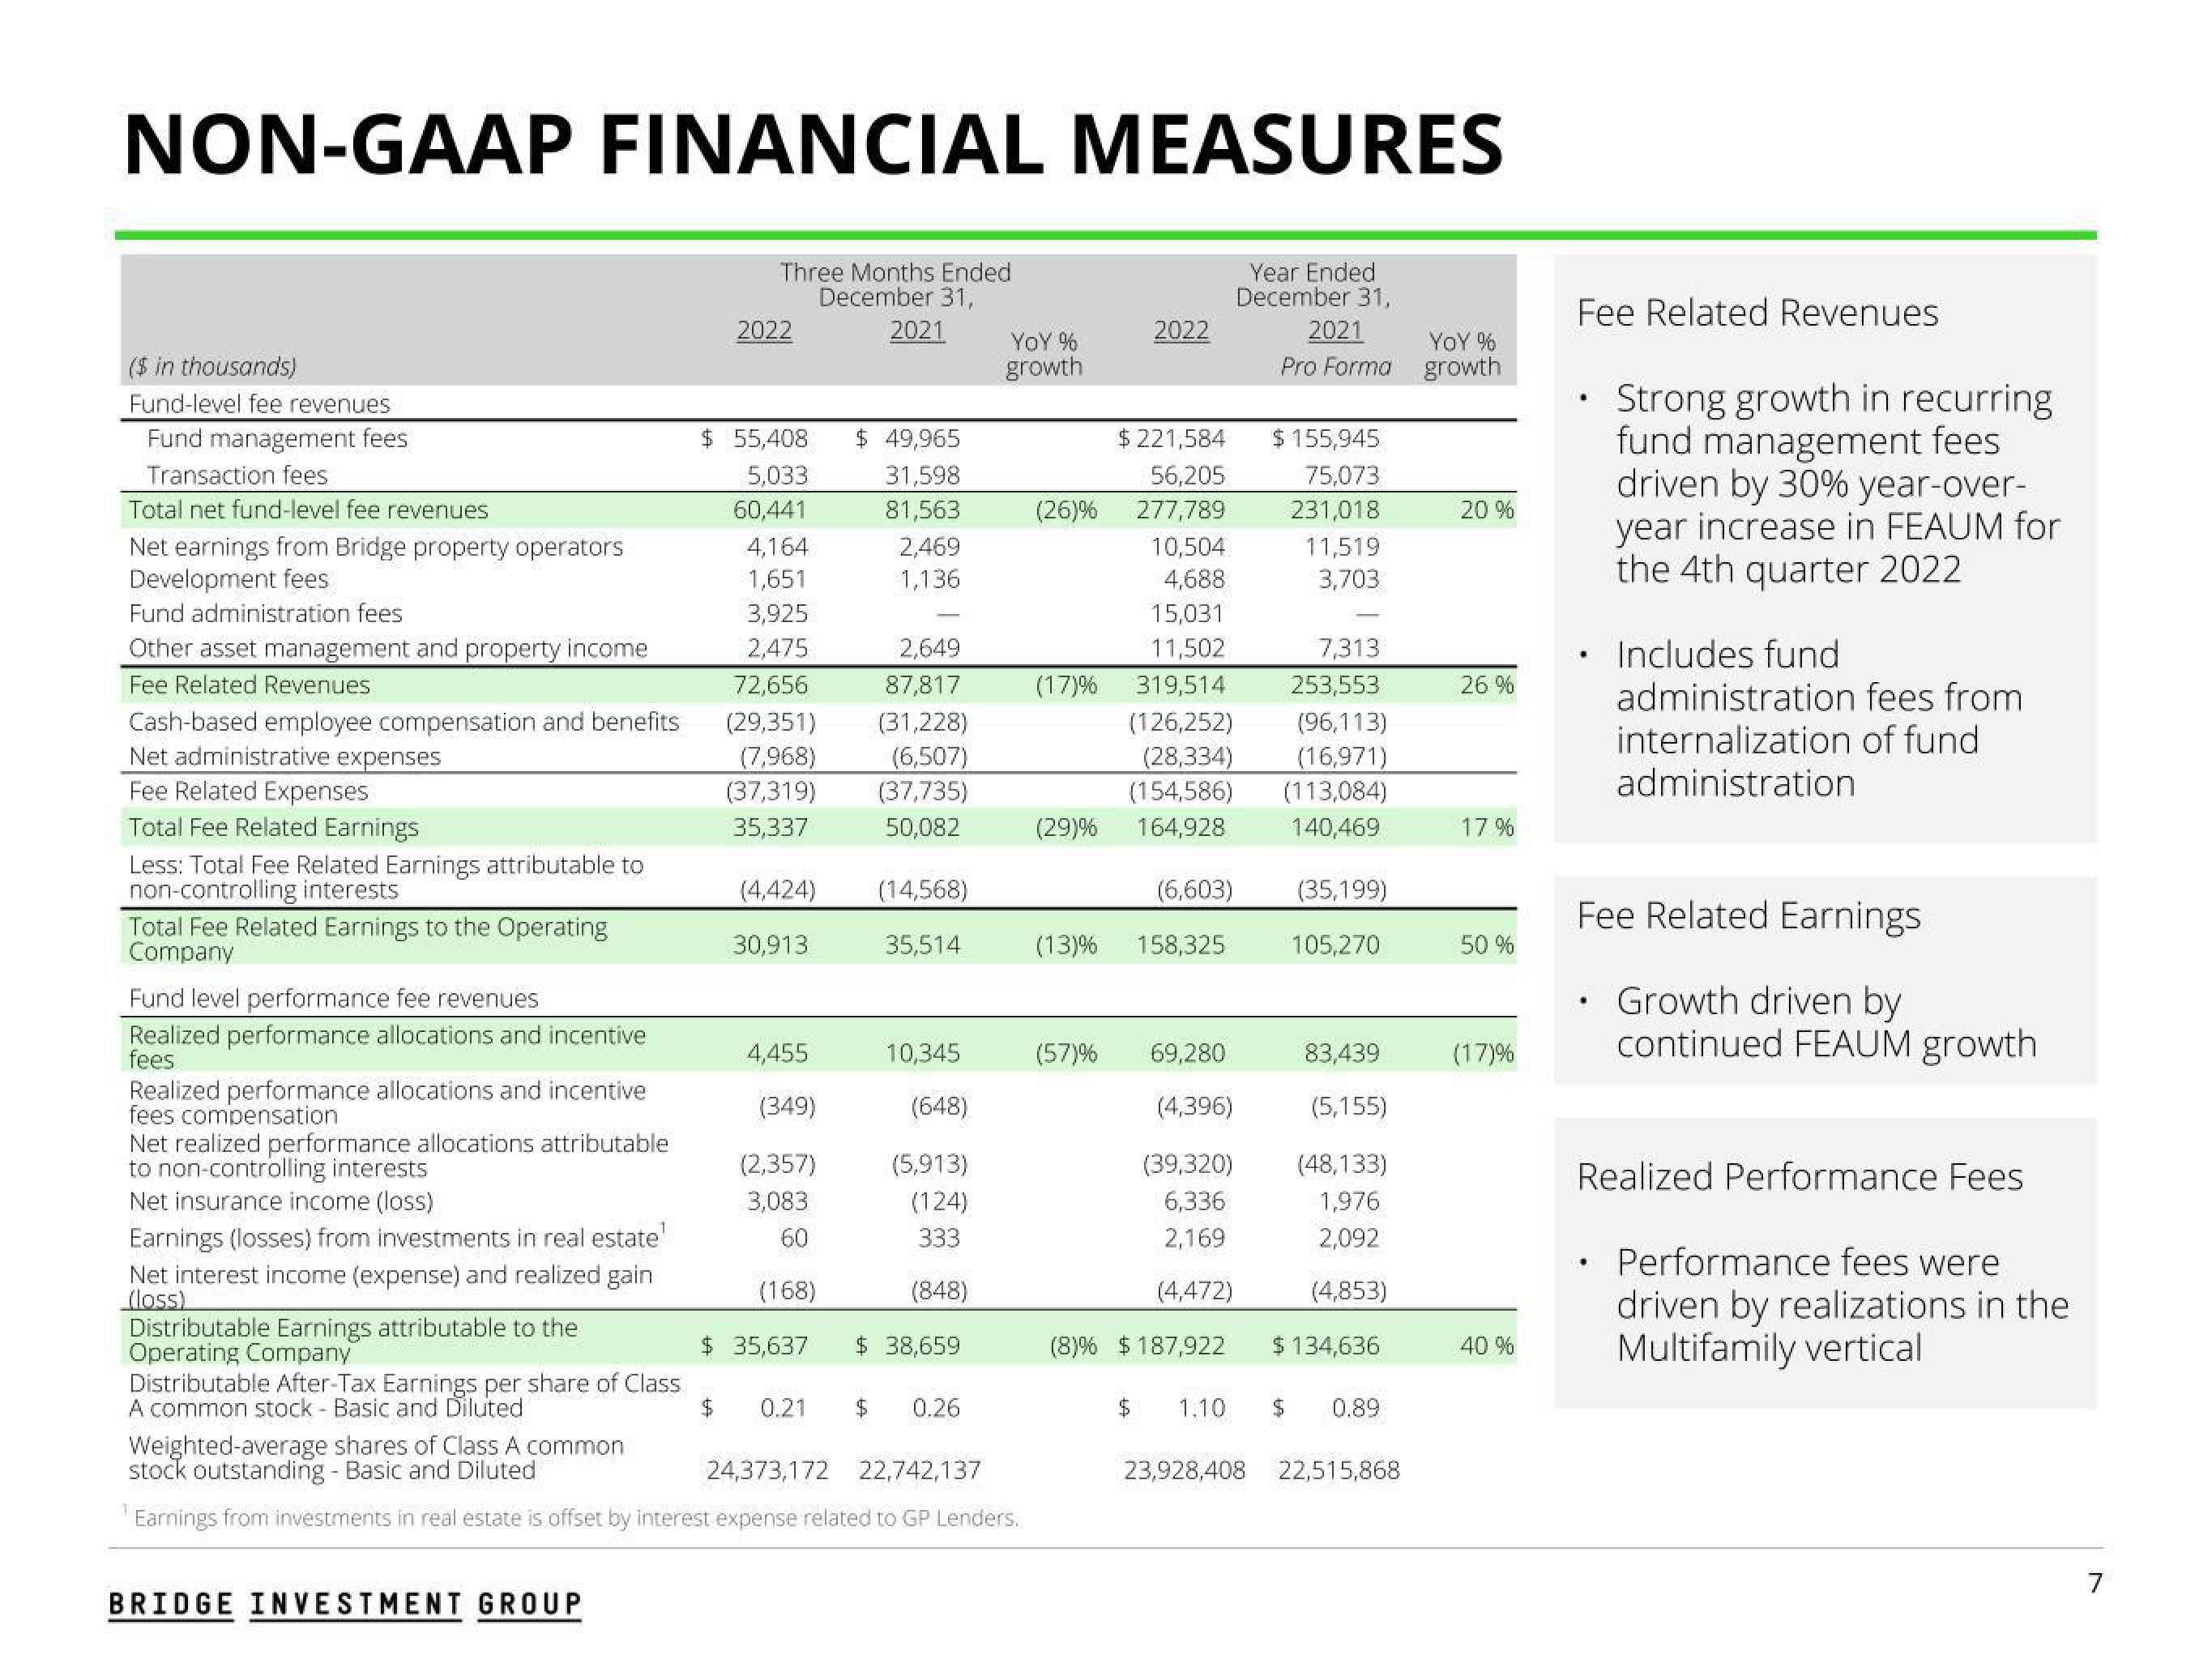
Fee Related Revenues
Strong growth in recurring
fund management fees
driven by 30% year-over-
year increase in FEAUM for
the 4th quarter 2022
.
Includes fund
administration fees from
internalization of fund
administration
Fee Related Earnings
Growth driven by
continued FEAUM growth
Realized Performance Fees
Performance fees were
driven by realizations in the
Multifamily vertical
7View entire presentation