J.P.Morgan 4Q23 Earnings Results
JPMORGAN CHASE & CO.
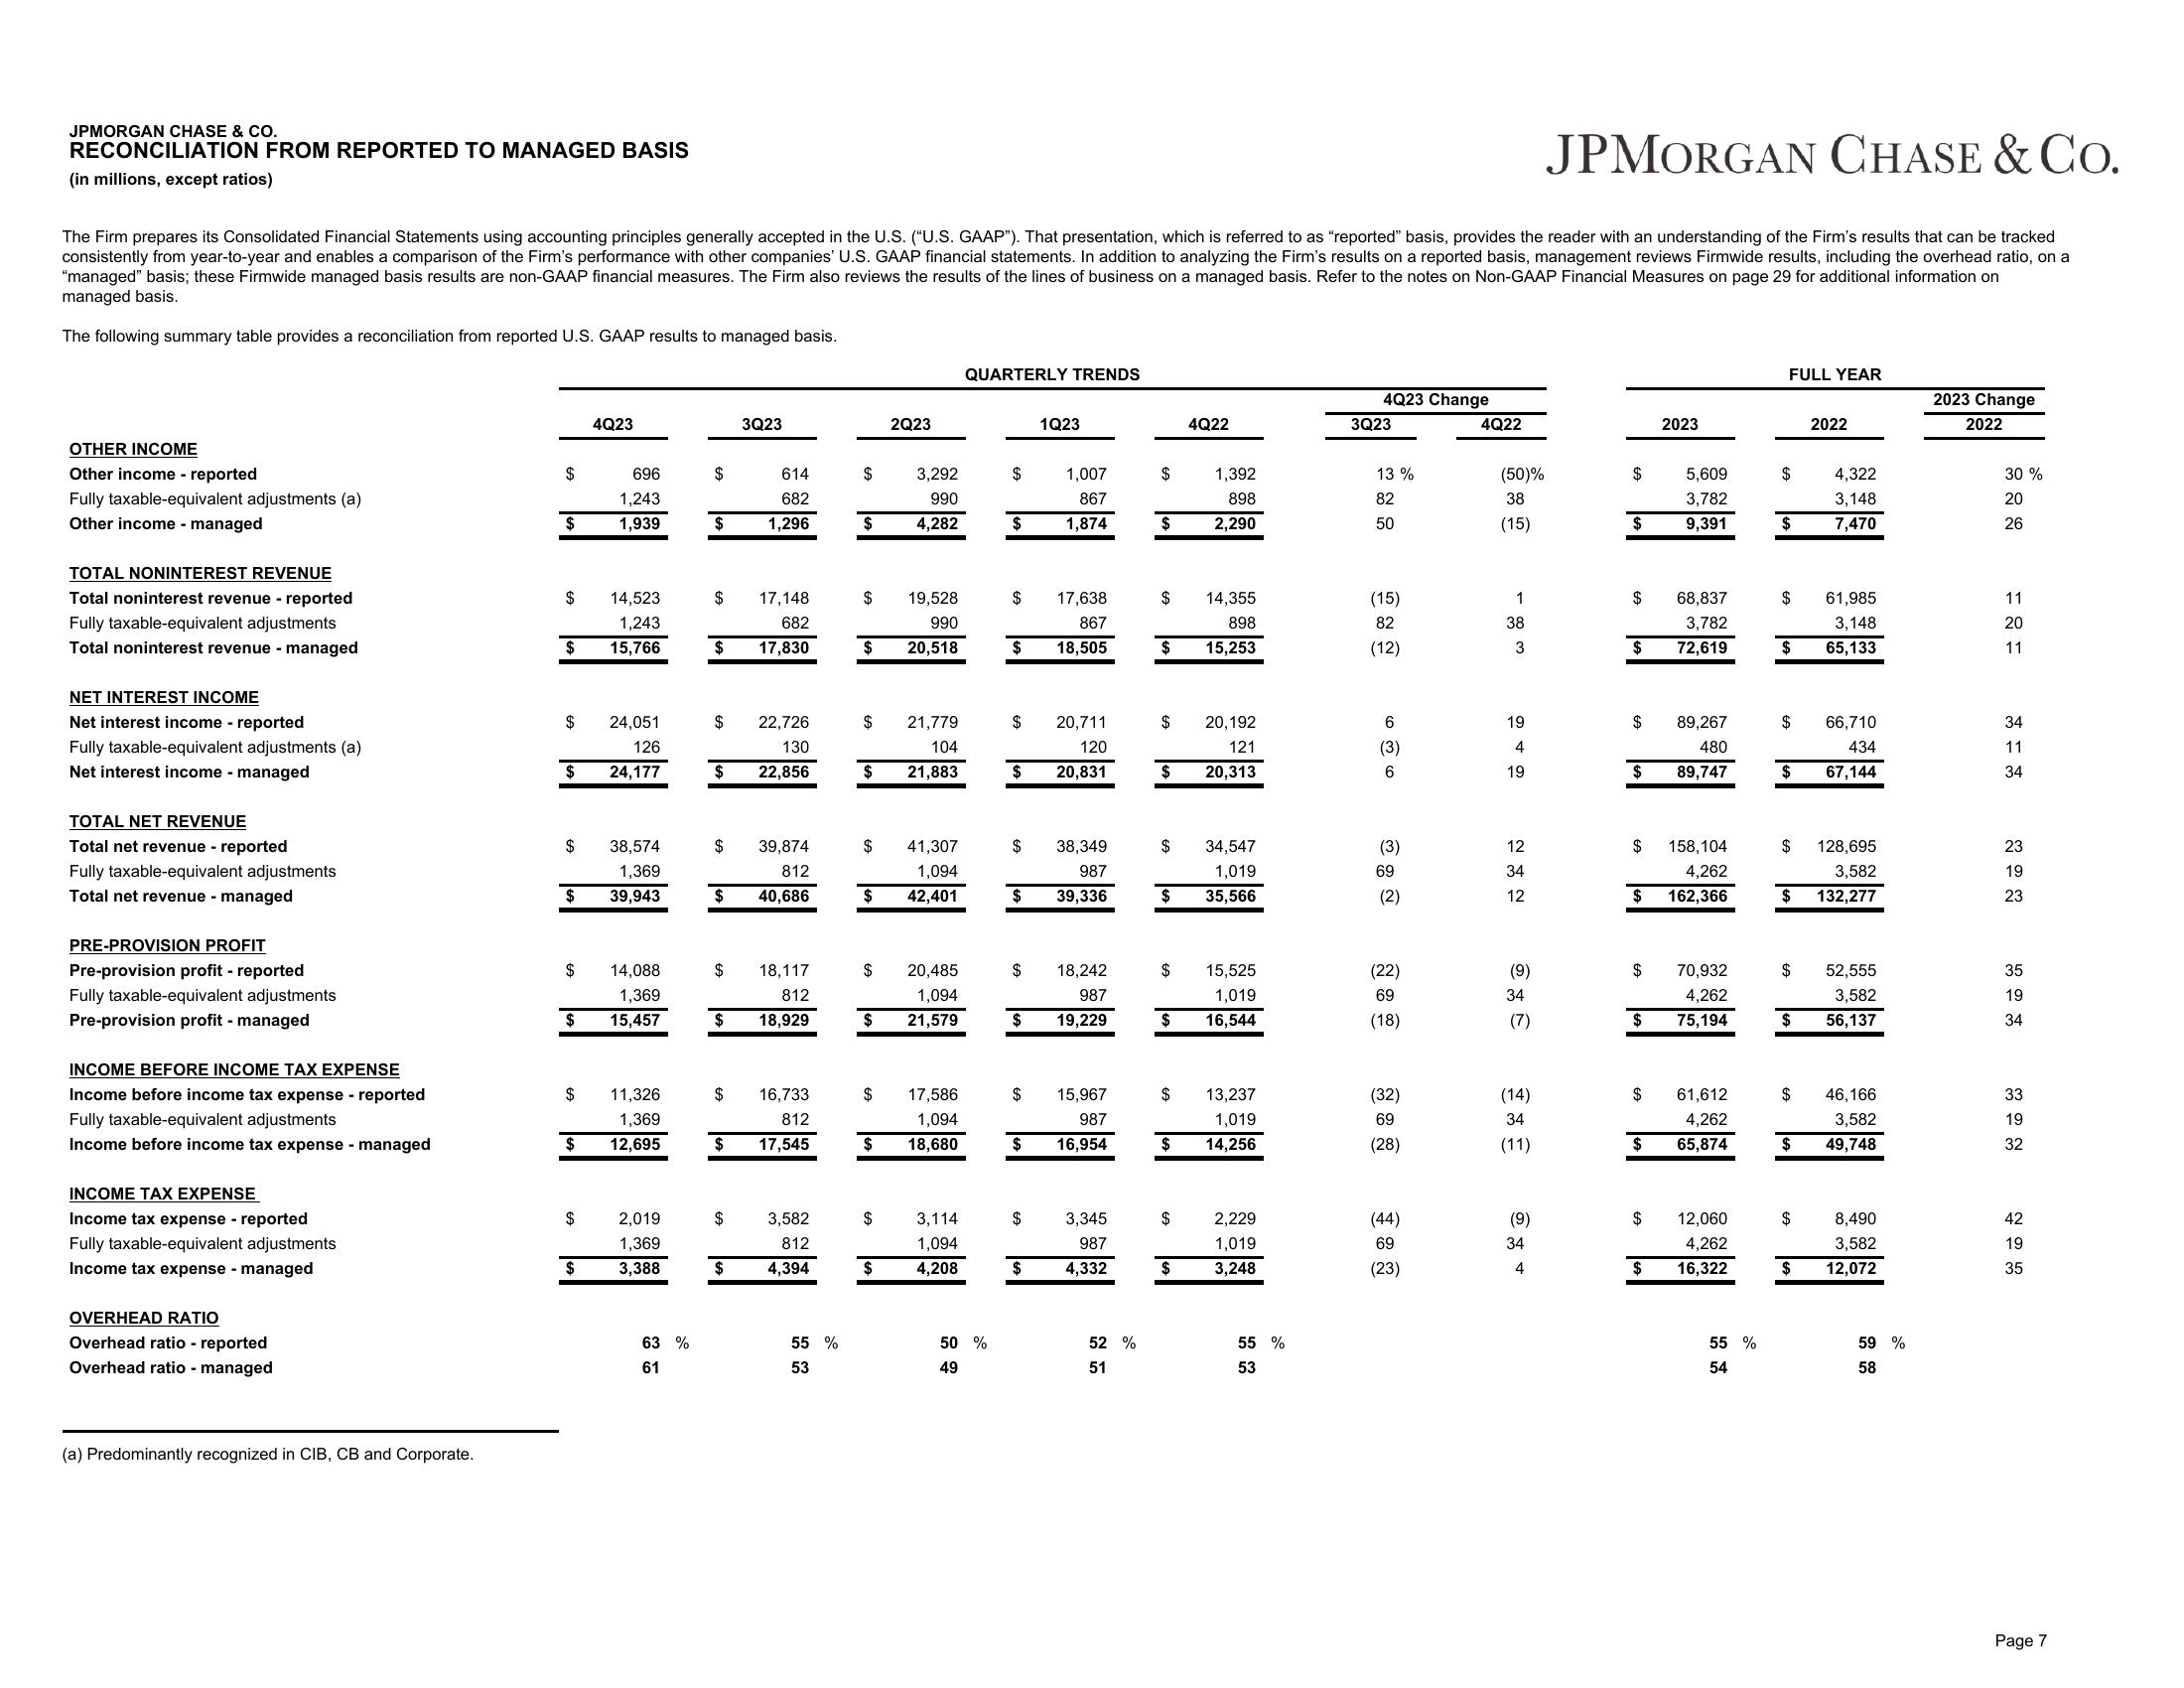
RECONCILIATION FROM REPORTED TO MANAGED BASIS
(in millions, except ratios)
JPMORGAN CHASE & CO.
The Firm prepares its Consolidated Financial Statements using accounting principles generally accepted in the U.S. ("U.S. GAAP"). That presentation, which is referred to as "reported" basis, provides the reader with an understanding of the Firm's results that can be tracked
consistently from year-to-year and enables a comparison of the Firm's performance with other companies' U.S. GAAP financial statements. In addition to analyzing the Firm's results on a reported basis, management reviews Firmwide results, including the overhead ratio, on a
"managed" basis; these Firmwide managed basis results are non-GAAP financial measures. The Firm also reviews the results of the lines of business on a managed basis. Refer to the notes on Non-GAAP Financial Measures on page 29 for additional information on
managed basis.
The following summary table provides a reconciliation from reported U.S. GAAP results to managed basis.
OTHER INCOME
Other income - reported
Fully taxable-equivalent adjustments (a)
Other income - managed
TOTAL NONINTEREST REVENUE
Total noninterest revenue reported
Fully taxable-equivalent adjustments
Total noninterest revenue managed
NET INTEREST INCOME
Net interest income - reported
Fully taxable-equivalent adjustments (a)
Net interest income-managed
TOTAL NET REVENUE
Total net revenue - reported
Fully taxable-equivalent adjustments
Total net revenue - managed
PRE-PROVISION PROFIT
Pre-provision profit - reported
Fully taxable-equivalent adjustments
Pre-provision profit - managed
INCOME BEFORE INCOME TAX EXPENSE
Income before income tax expense reported
Fully taxable-equivalent adjustments
Income before income tax expense managed
INCOME TAX EXPENSE
Income tax expense - reported
Fully taxable-equivalent adjustments
Income tax expense - managed
OVERHEAD RATIO
Overhead ratio - reported
Overhead ratio - managed
(a) Predominantly recognized in CIB, CB and Corporate.
$
696
1,243
$ 1,939
$
$
$
$ 24,051
126
$ 24,177
$
$
$
$
$
4Q23
$
$
14,523
1,243
15,766
38,574
1,369
39,943
14,088
1,369
15,457
11,326
1,369
12,695
2,019
1,369
3,388
63 %
61
$
$
$
$
$
$
$
$
$
$
$
$
3Q23
$
614
682
1,296
17,148
682
17,830
22,726
130
22,856
39,874
812
40,686
16,733
812
$ 17,545
18,117
812
18,929
3,582
812
4,394
55 %
53
$
$
$
$
$
$
$
$
$
$
2Q23
$
3,292
990
4,282
19,528
990
20,518
$ 20,485
1,094
$ 21,579
21,779
104
21,883
41,307
1,094
42,401
17,586
1,094
18,680
3,114
1,094
4,208
QUARTERLY TRENDS
50 %
49
$
$
$
$ 17,638
867
18,505
$
$
$
$
$
1Q23
$
1,007
867
1,874
18,242
987
$ 19,229
$
$
20,711
120
20,831
$ 15,967
987
16,954
38,349
987
39,336
3,345
987
4,332
52 %
51
$
$
$
$
$
$ 20,192
121
20,313
$
$
34,547
1,019
$ 35,566
$
4Q22
1,392
898
2,290
$
14,355
898
15,253
$
$ 13,237
1,019
14,256
15,525
1,019
16,544
2,229
1,019
$ 3,248
55 %
53
4Q23 Change
3Q23
13%
82
50
(15)
82
(12)
6
(3)
6
(3)
69
(2)
(22)
69
(18)
(32)
69
(28)
(44)
69
(23)
4Q22
(50)%
38
(15)
1
38
3
19
4
19
12
34
12
(9)
34
(7)
(14)
34
(11)
(9)
34
4
$
$
$
$ 68,837
3,782
$ 72,619
$
$
$
$
$
$
2023
$
5,609
3,782
9,391
89,267
480
89,747
158,104
4,262
162,366
70,932
4,262
75,194
61,612
4,262
65,874
$ 12,060
4,262
$ 16,322
55 %
54
FULL YEAR
$
$
$
$
61,985
3,148
$ 65,133
$
$
$
$
$
$
$
$
2022
$
4,322
3,148
7,470
66,710
434
67,144
128,695
3,582
132,277
52,555
3,582
56,137
46,166
3,582
49,748
8,490
3,582
12,072
59 %
58
2023 Change
2022
30%
20
26
11
20
11
34
11
34
23
19
23
35
19
34
33
19
32
42
19
35
Page 7View entire presentation