UBS Results Presentation Deck
Excluding Credit Suisse
UBS business divisions: Asset Management
Total revenues
m
(5%) excl.
gains on sale¹
(64%)
r
1,372
848
524
Profit before tax
m
(19%) excl.
gains on sale¹
(91%)
r
959
499
848
111
2Q22
90
2Q23
Gains on sale¹
USD m, except where indicated
Total revenues
Net management fees
Performance fees
Net gain from disposal of a
joint venture¹
Credit loss expense / (release)
Operating expenses
Profit before tax
Cost / income ratio
Invested assets, bn
Net new money, bn
2Q23
499
492
7
0
409
90
82%
1Q23 2Q22 QoQ
17
502 1,372 (1%) (64%)
479 515
+3% (5%)
(69%) (23%)
23
0
408
94
1,188 1,140
9
14
848
0
413
YoY
959
81% 30%² +1pp +52pp
1,047 +4% +13%
(9)
0% (1%)
(5%) (91%)
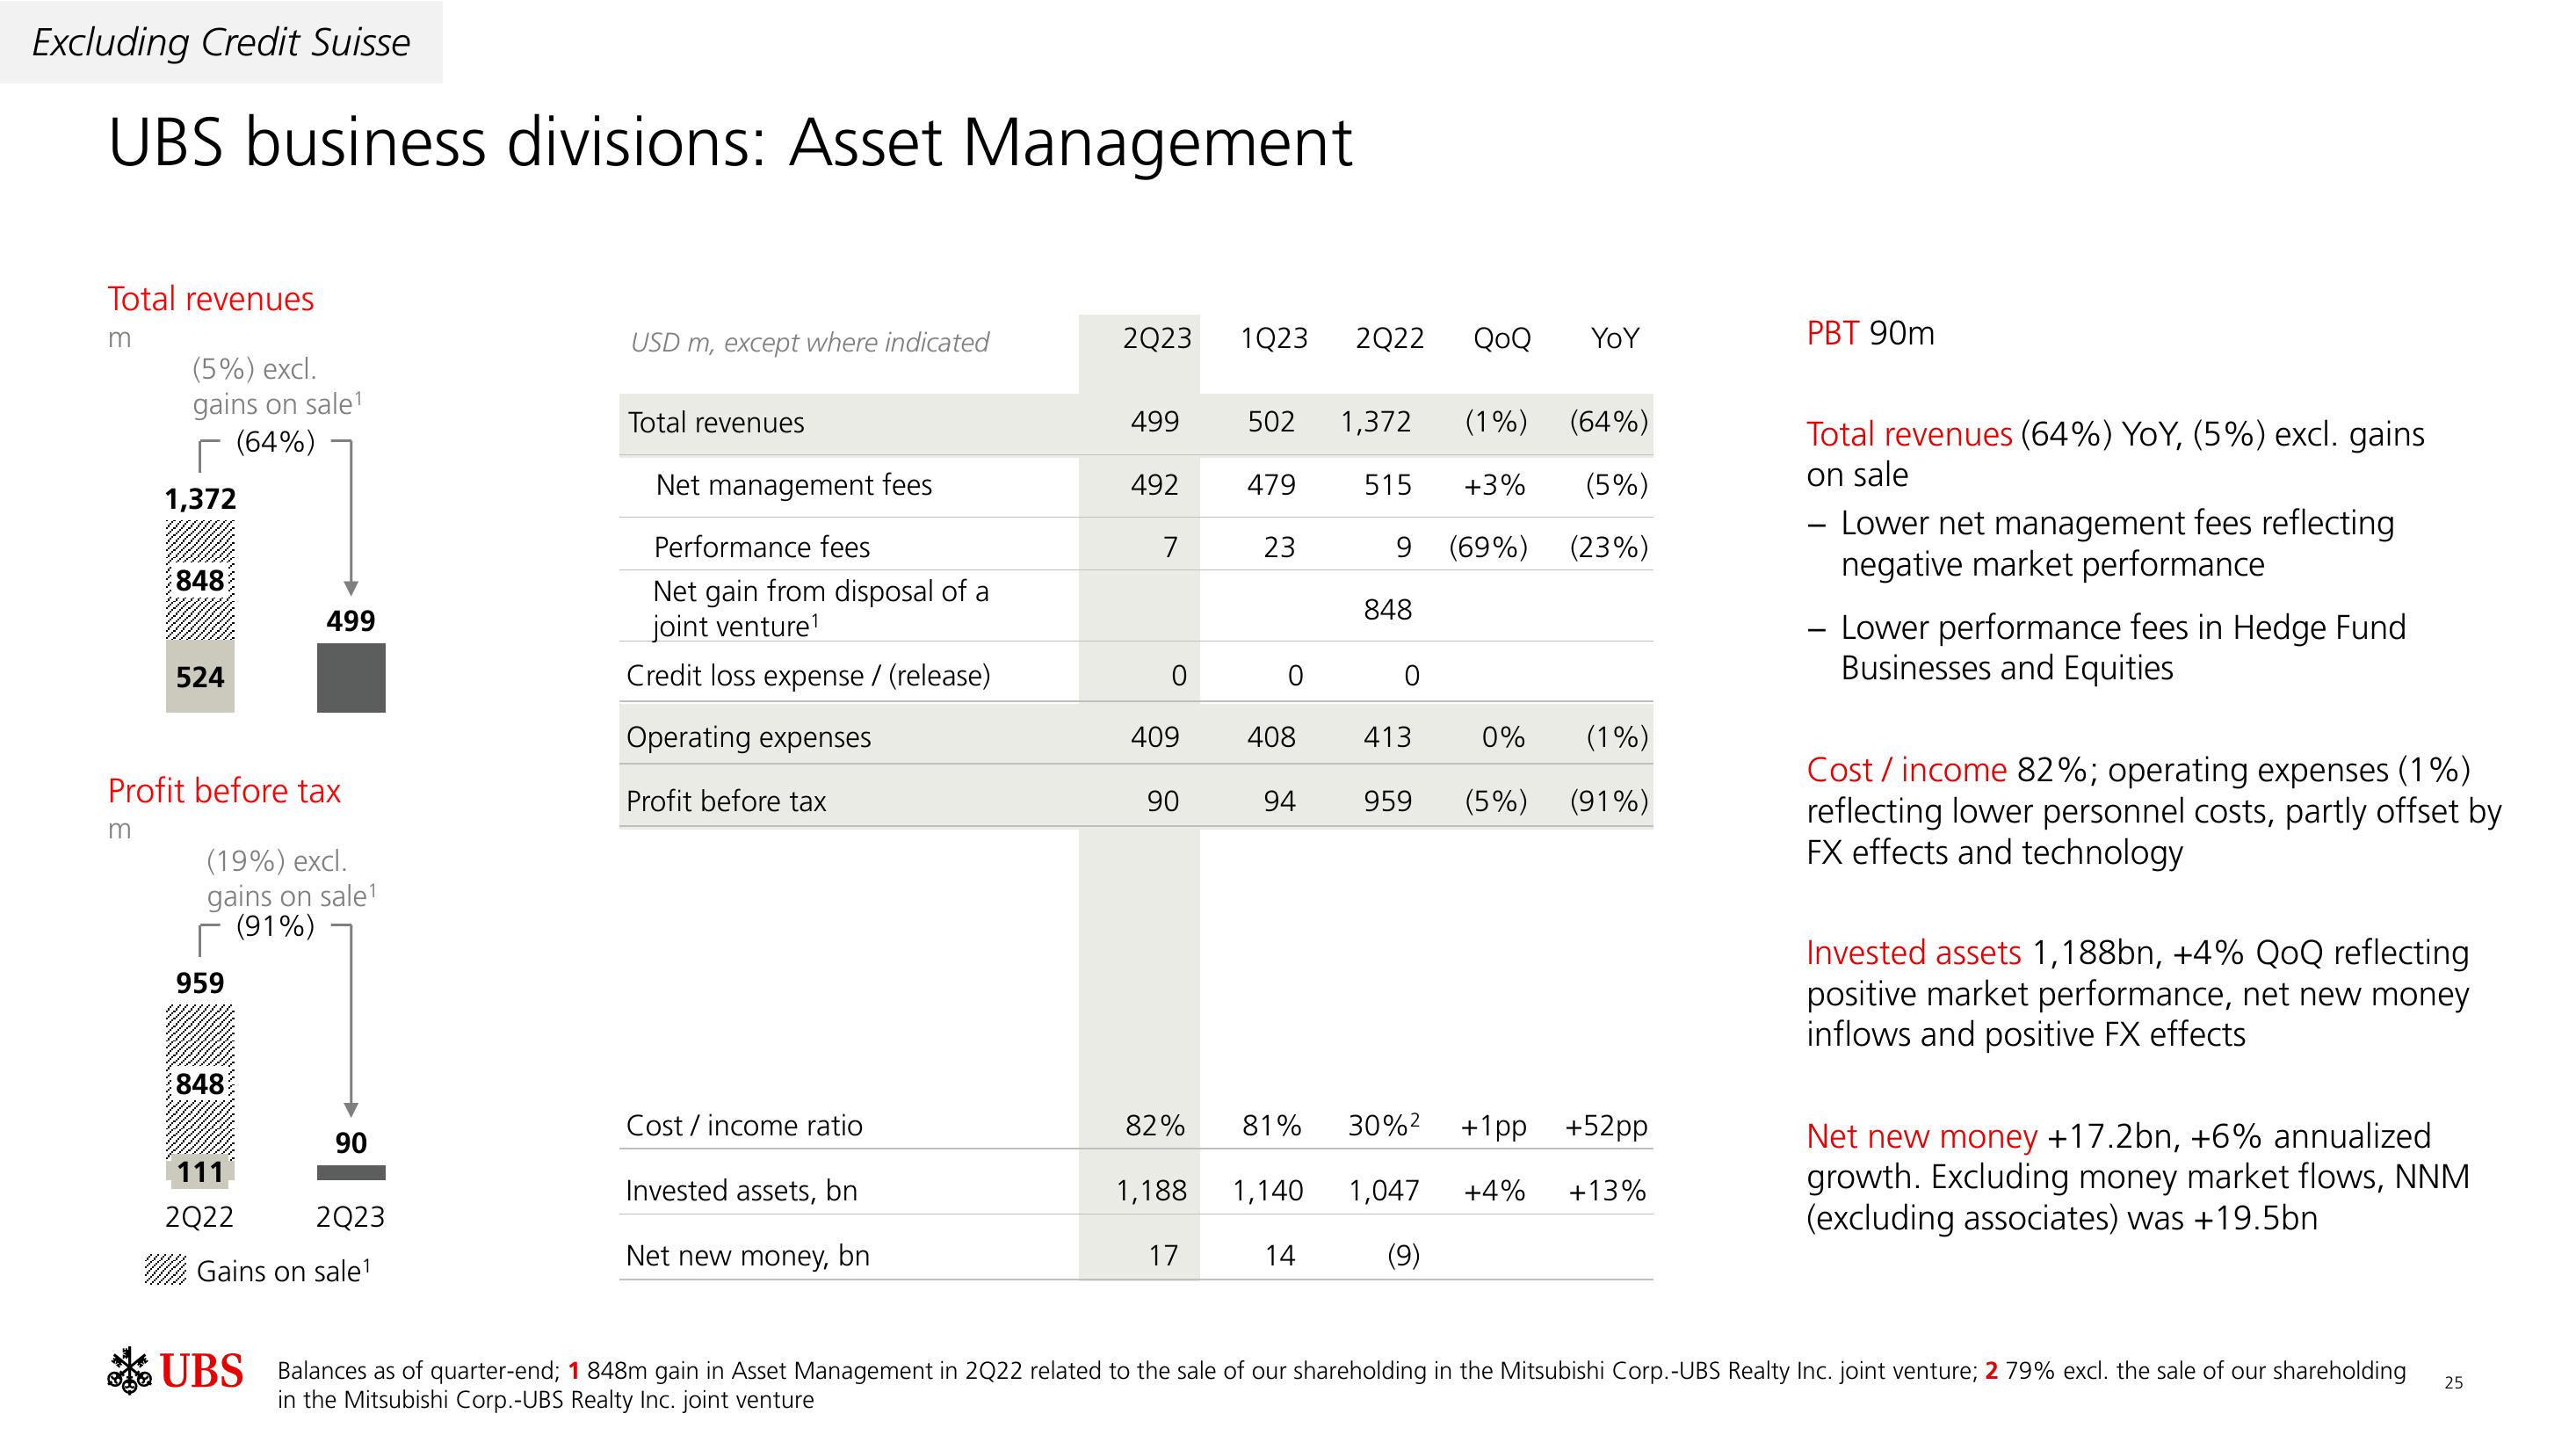
PBT 90m
Total revenues (64%) YoY, (5%) excl. gains
on sale
- Lower net management fees reflecting
negative market performance
- Lower performance fees in Hedge Fund.
Businesses and Equities
Cost/income 82%; operating expenses (1%)
reflecting lower personnel costs, partly offset by
FX effects and technology
Invested assets 1,188bn, +4% QoQ reflecting
positive market performance, net new money
inflows and positive FX effects
Net new money +17.2bn, +6% annualized
growth. Excluding money market flows, NNM
(excluding associates) was +19.5bn
UBS Balances as of quarter-end; 1 848m gain in Asset Management in 2Q22 related to the sale of our shareholding in the Mitsubishi Corp.-UBS Realty Inc. joint venture; 2 79% excl. the sale of our shareholding
in the Mitsubishi Corp.-UBS Realty Inc. joint venture
25View entire presentation