Antofagasta Results Presentation Deck
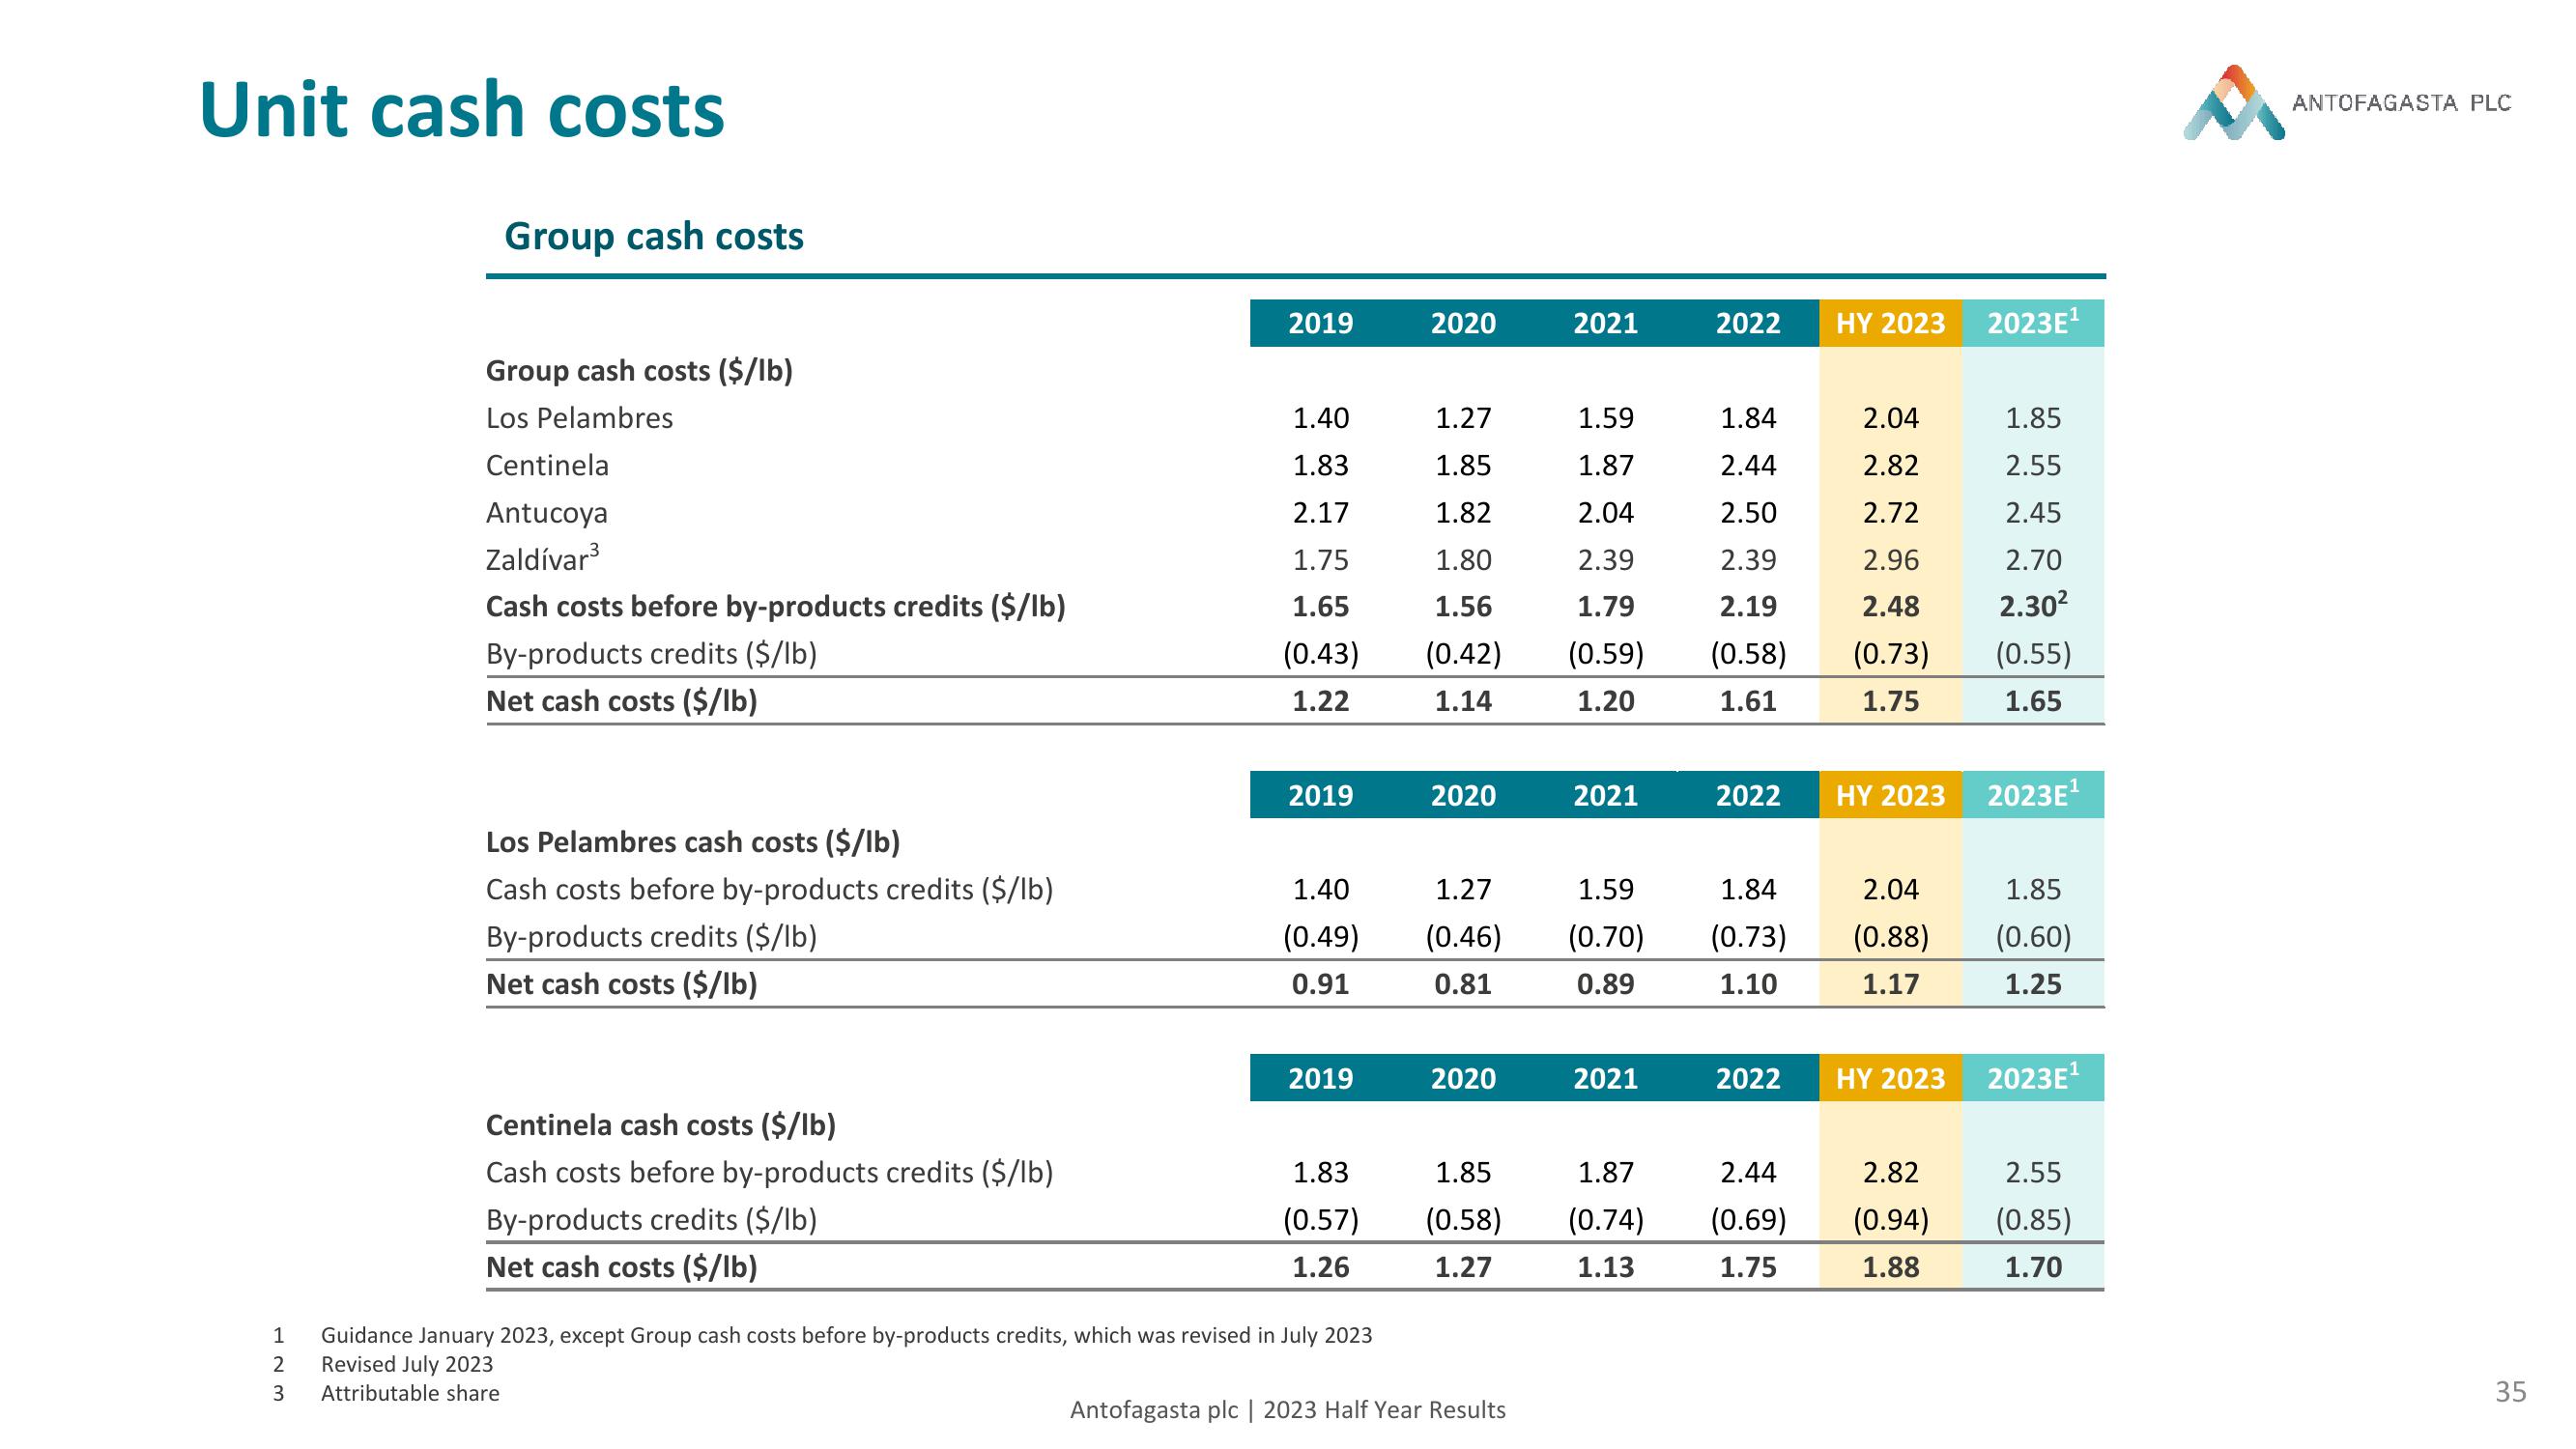
Unit cash costs
1
2
3
Group cash costs
Group cash costs ($/lb)
Los Pelambres
Centinela
Antucoya
Zaldívar³
Cash costs before by-products credits ($/lb)
By-products credits ($/lb)
Net cash costs ($/lb)
Los Pelambres cash costs ($/lb)
Cash costs before by-products credits ($/lb)
By-products credits ($/lb)
Net cash costs ($/lb)
Centinela cash costs ($/lb)
Cash costs before by-products credits ($/lb)
By-products credits ($/lb)
Net cash costs ($/lb)
2019
1.40
1.83
2.17
1.75
1.65
(0.43)
1.22
2019
1.40
(0.49)
0.91
2019
1.83
(0.57)
1.26
Guidance January 2023, except Group cash costs before by-products credits, which was revised in July 2023
Revised July 2023
Attributable share
2020
1.27
1.85
1.82
1.80
1.56
(0.42)
1.14
2020
1.27
(0.46)
0.81
2020
2021
Antofagasta plc | 2023 Half Year Results
1.59
1.87
2.04
2.39
1.79
(0.59)
1.20
2021
1.59
(0.70)
0.89
2021
1.85
1.87
(0.58) (0.74)
1.27
1.13
2022
1.84
2.44
2.50
2.39
2.19
(0.58)
1.61
2022
HY 2023
2022
2.04
2.82
2.72
2.96
2.48
(0.73)
1.75
HY 2023
1.84
2.04
(0.73) (0.88)
1.17
1.10
HY 2023
2.44
2.82
(0.69) (0.94)
1.75
1.88
2023E¹
1.85
2.55
2.45
2.70
2.30²
(0.55)
1.65
2023E¹
1.85
(0.60)
1.25
2023E¹
2.55
(0.85)
1.70
ANTOFAGASTA PLC
35View entire presentation