EVBox SPAC Presentation Deck
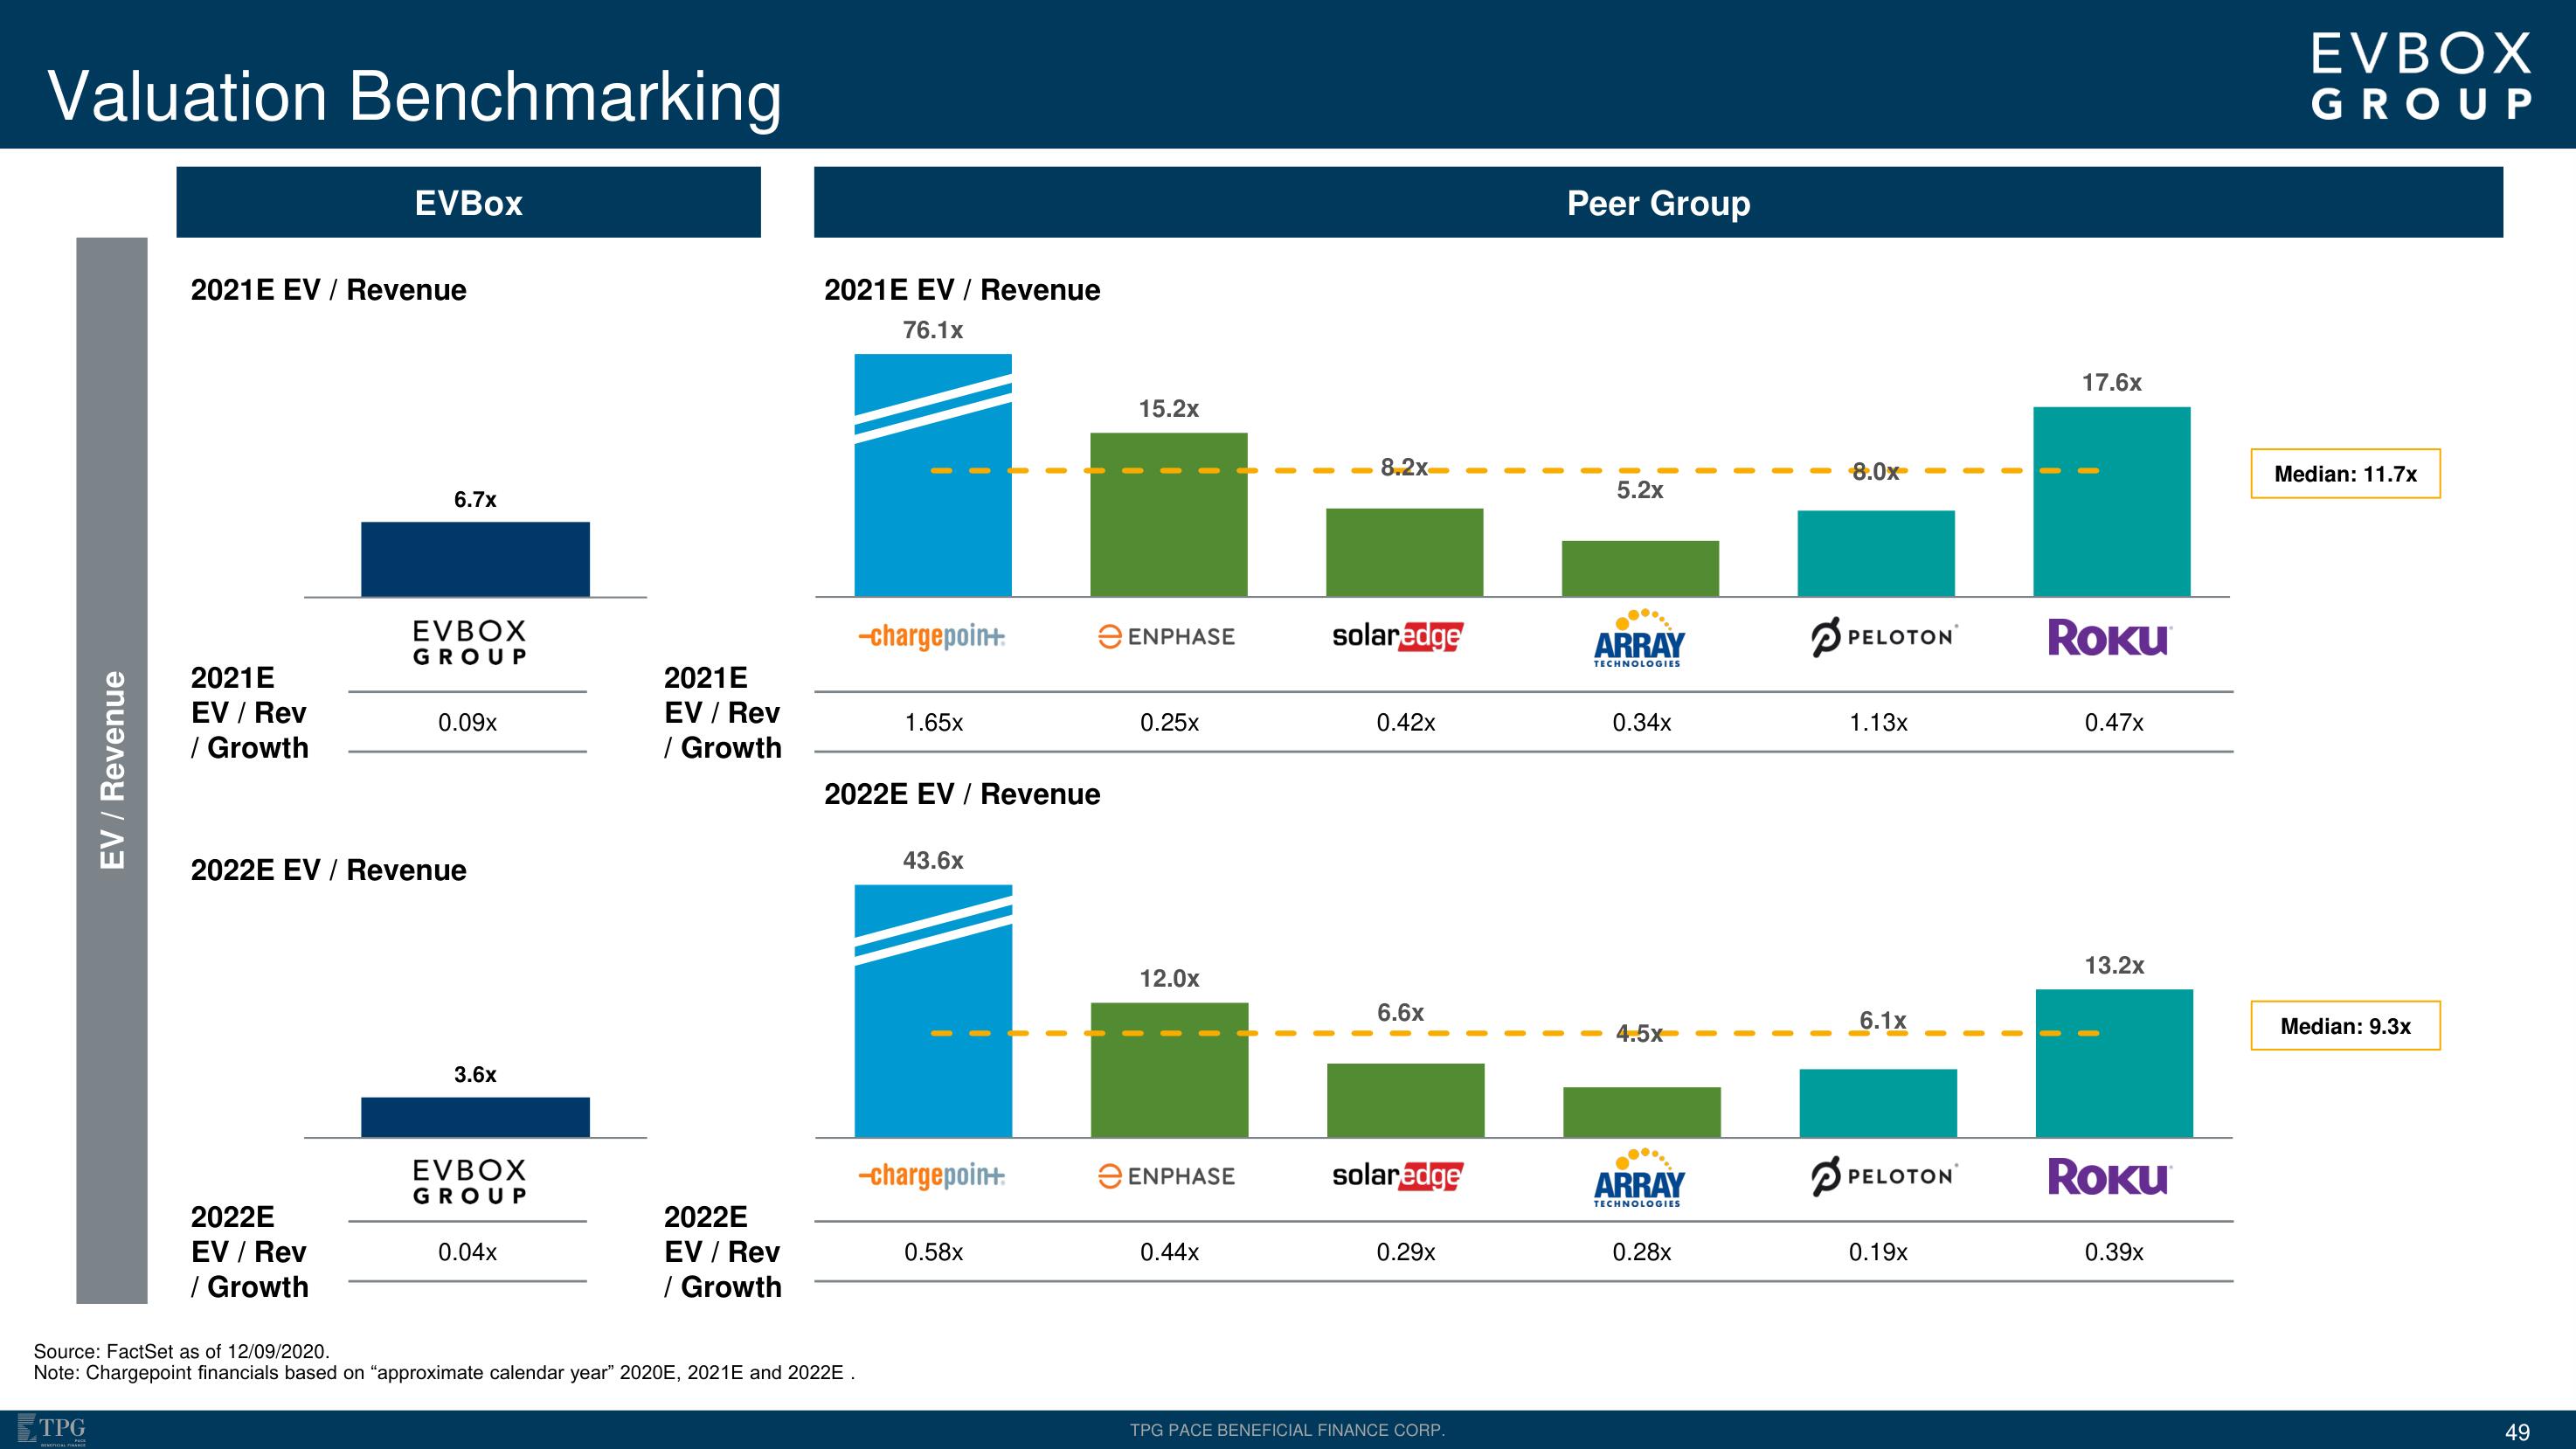
Valuation Benchmarking
EV / Revenue
TPG
2021E EV / Revenue
2021E
EV / Rev
/ Growth
EVBOX
2022E
EV / Rev
/ Growth
6.7x
EVBOX
GROUP
0.09x
2022E EV / Revenue
3.6x
EVBOX
GROUP
0.04x
2021E
EV / Rev
/ Growth
2022E
EV / Rev
/ Growth
2021E EV / Revenue
76.1x
Source: FactSet as of 12/09/2020.
Note: Chargepoint financials based on "approximate calendar year" 2020E, 2021E and 2022E.
-chargepoin+
1.65x
2022E EV / Revenue
43.6x
-chargepoint.
0.58x
15.2x
e ENPHASE
0.25x
12.0x
e ENPHASE
0.44x
8.2x
solaredge
0.42x
6.6x
solaredge
0.29x
TPG PACE BENEFICIAL FINANCE CORP.
Peer Group
5.2x
ARRAY
TECHNOLOGIES
0.34x
4.5x
ARRAY
TECHNOLOGIES
0.28x
8.0x
P PELOTON
1.13x
6.1x
PELOTON
0.19x
17.6x
Roku
0.47x
13.2x
Roku
0.39x
EVBOX
GROUP
Median: 11.7x
Median: 9.3x
49View entire presentation