Opendoor Investor Presentation Deck
Robust risk management framework
Dynamic and responsive pricing
using high-frequency detailed metrics
Diversification and risk mitigation
benefits
with scale across markets, price levels and home types
Centralized decision making
across pricing ensures consistency, scalability
and appropriate controls
Human oversight
augments algorithmic valuations for all final offers
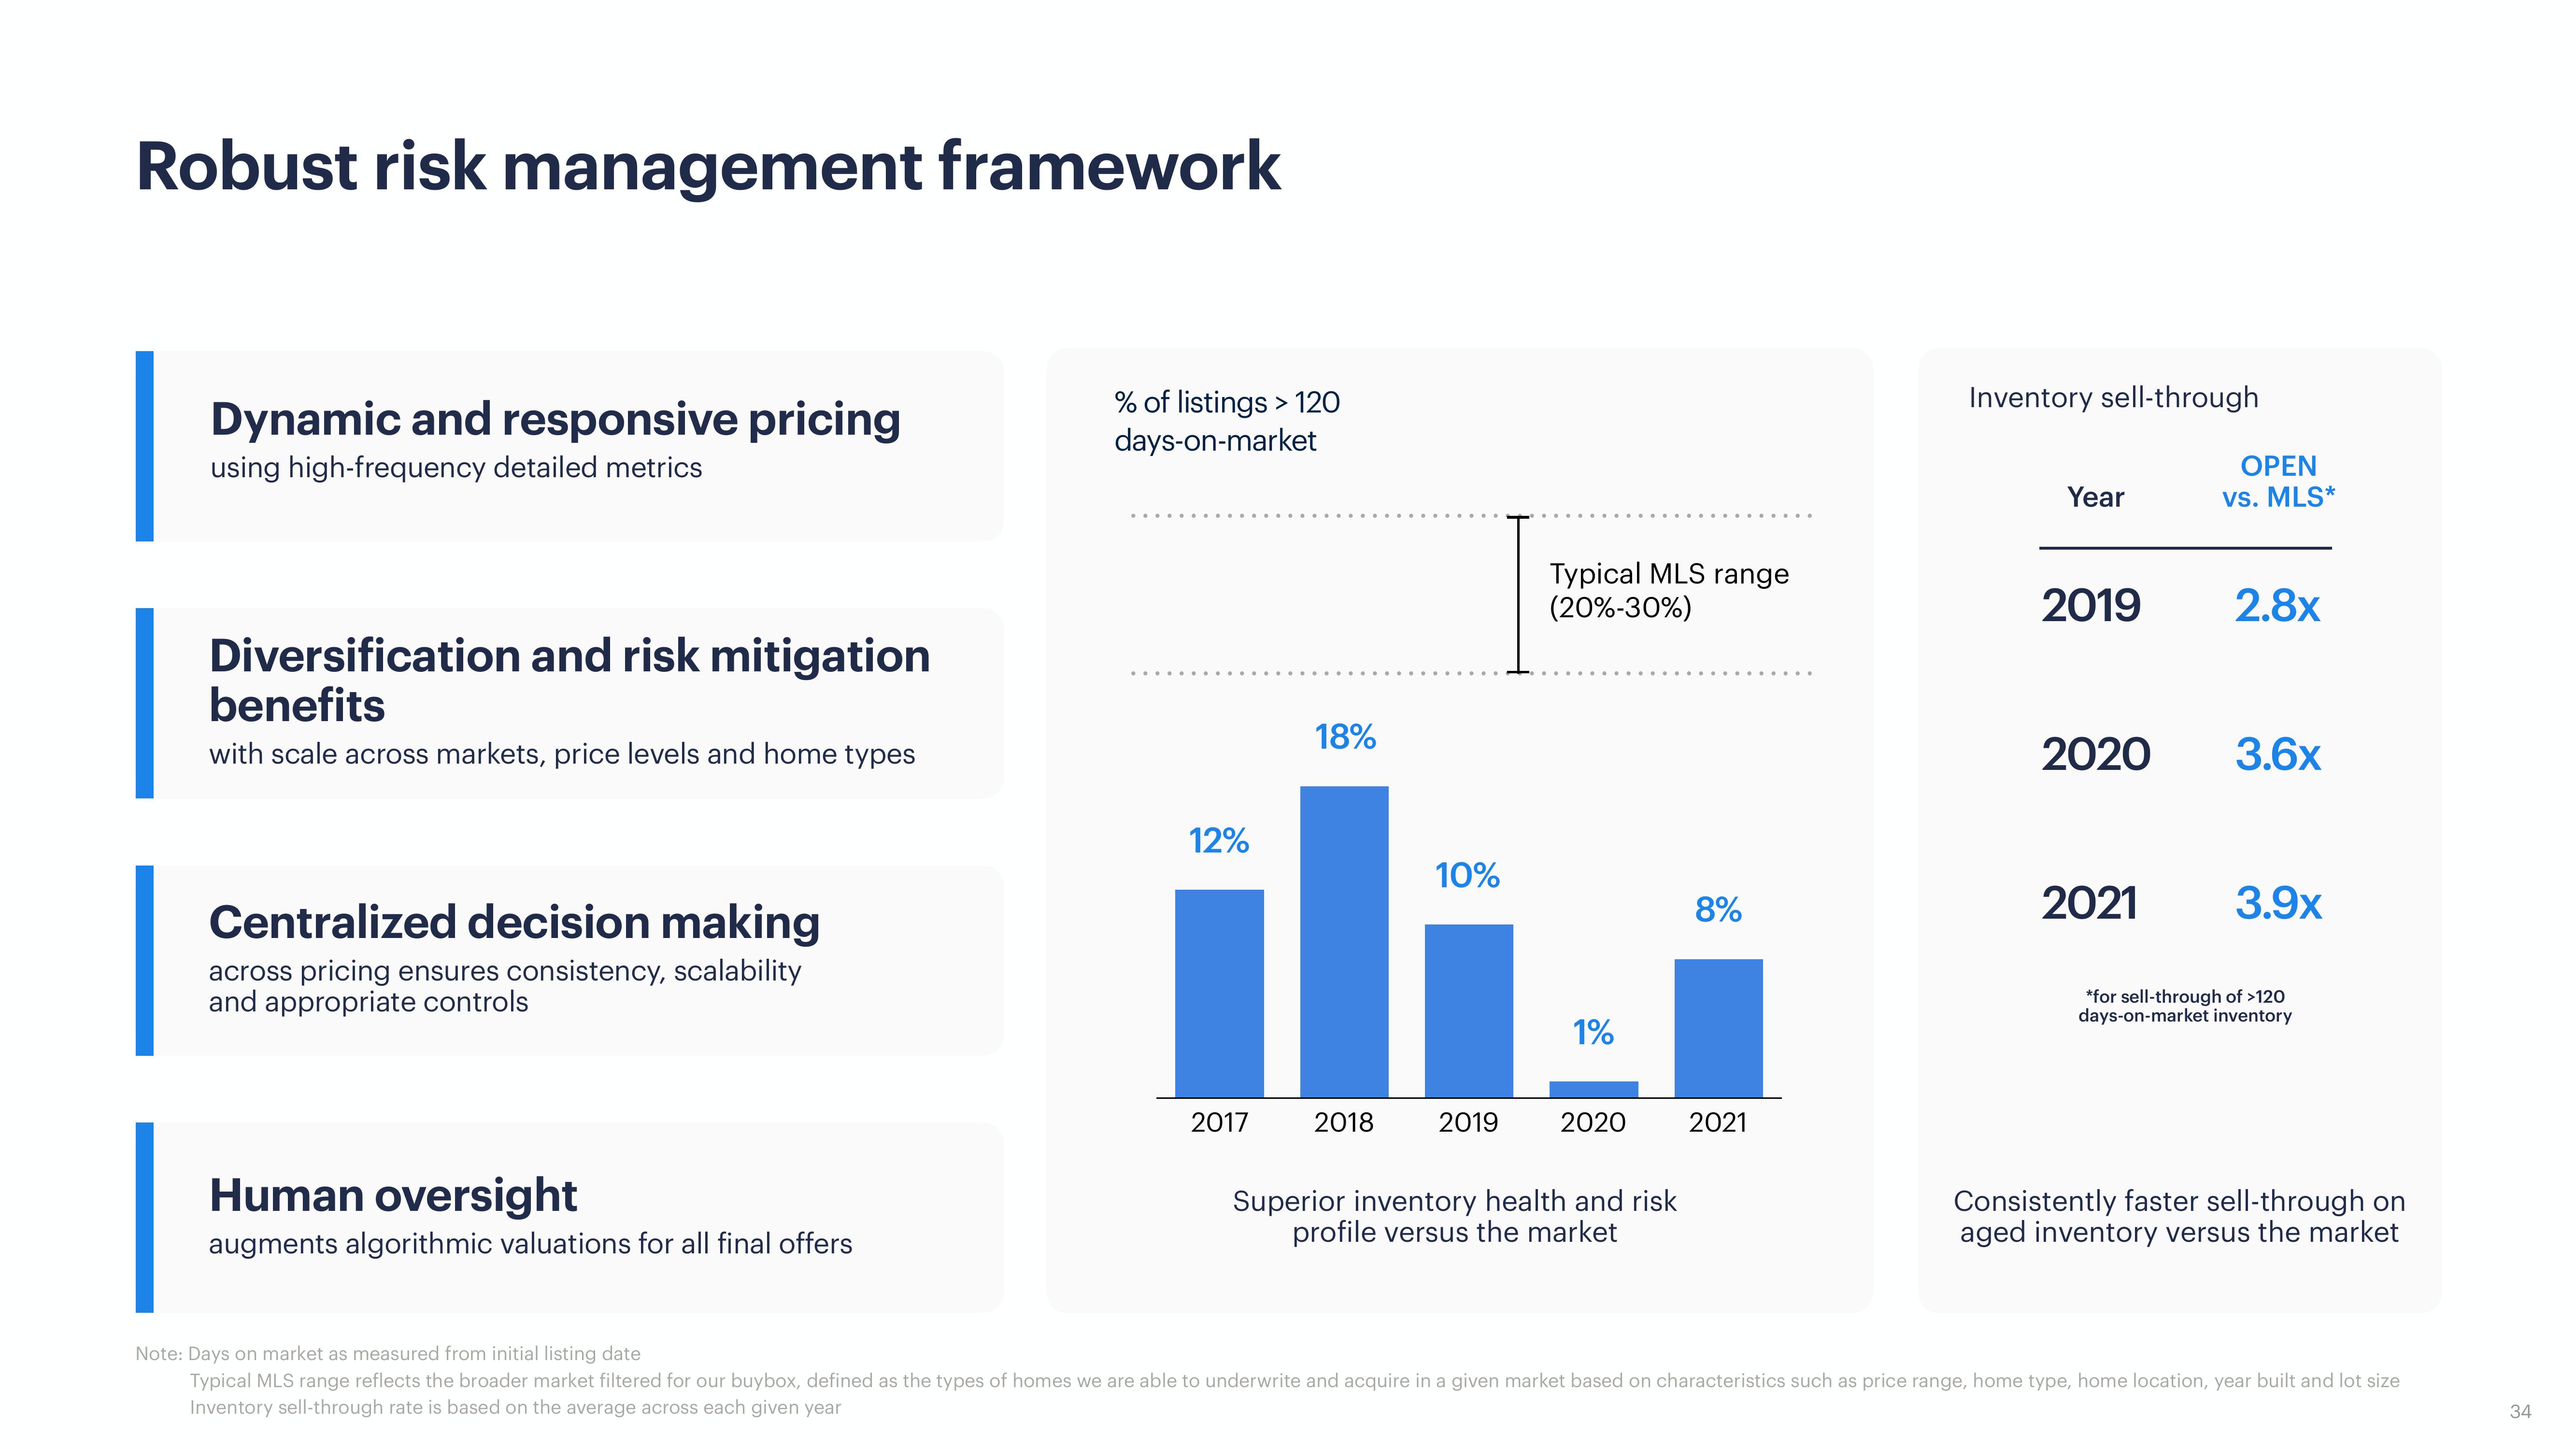
% of listings > 120
days-on-market
12%
2017
18%
2018
10%
Typical MLS range
(20%-30%)
1%
2019 2020
Superior inventory health and risk
profile versus the market
8%
2021
Inventory sell-through
Year
2019
2020
2021
OPEN
vs. MLS*
2.8x
3.6x
3.9x
*for sell-through of >120
days-on-market inventory
Consistently faster sell-through on
aged inventory versus the market
Note: Days on market as measured from initial listing date
Typical MLS range reflects the broader market filtered for our buybox, defined as the types of homes we are able to underwrite and acquire in a given market based on characteristics such as price range, home type, home location, year built and lot size
Inventory sell-through rate is based on the average across each given year
34View entire presentation