Pathward Financial Results Presentation Deck
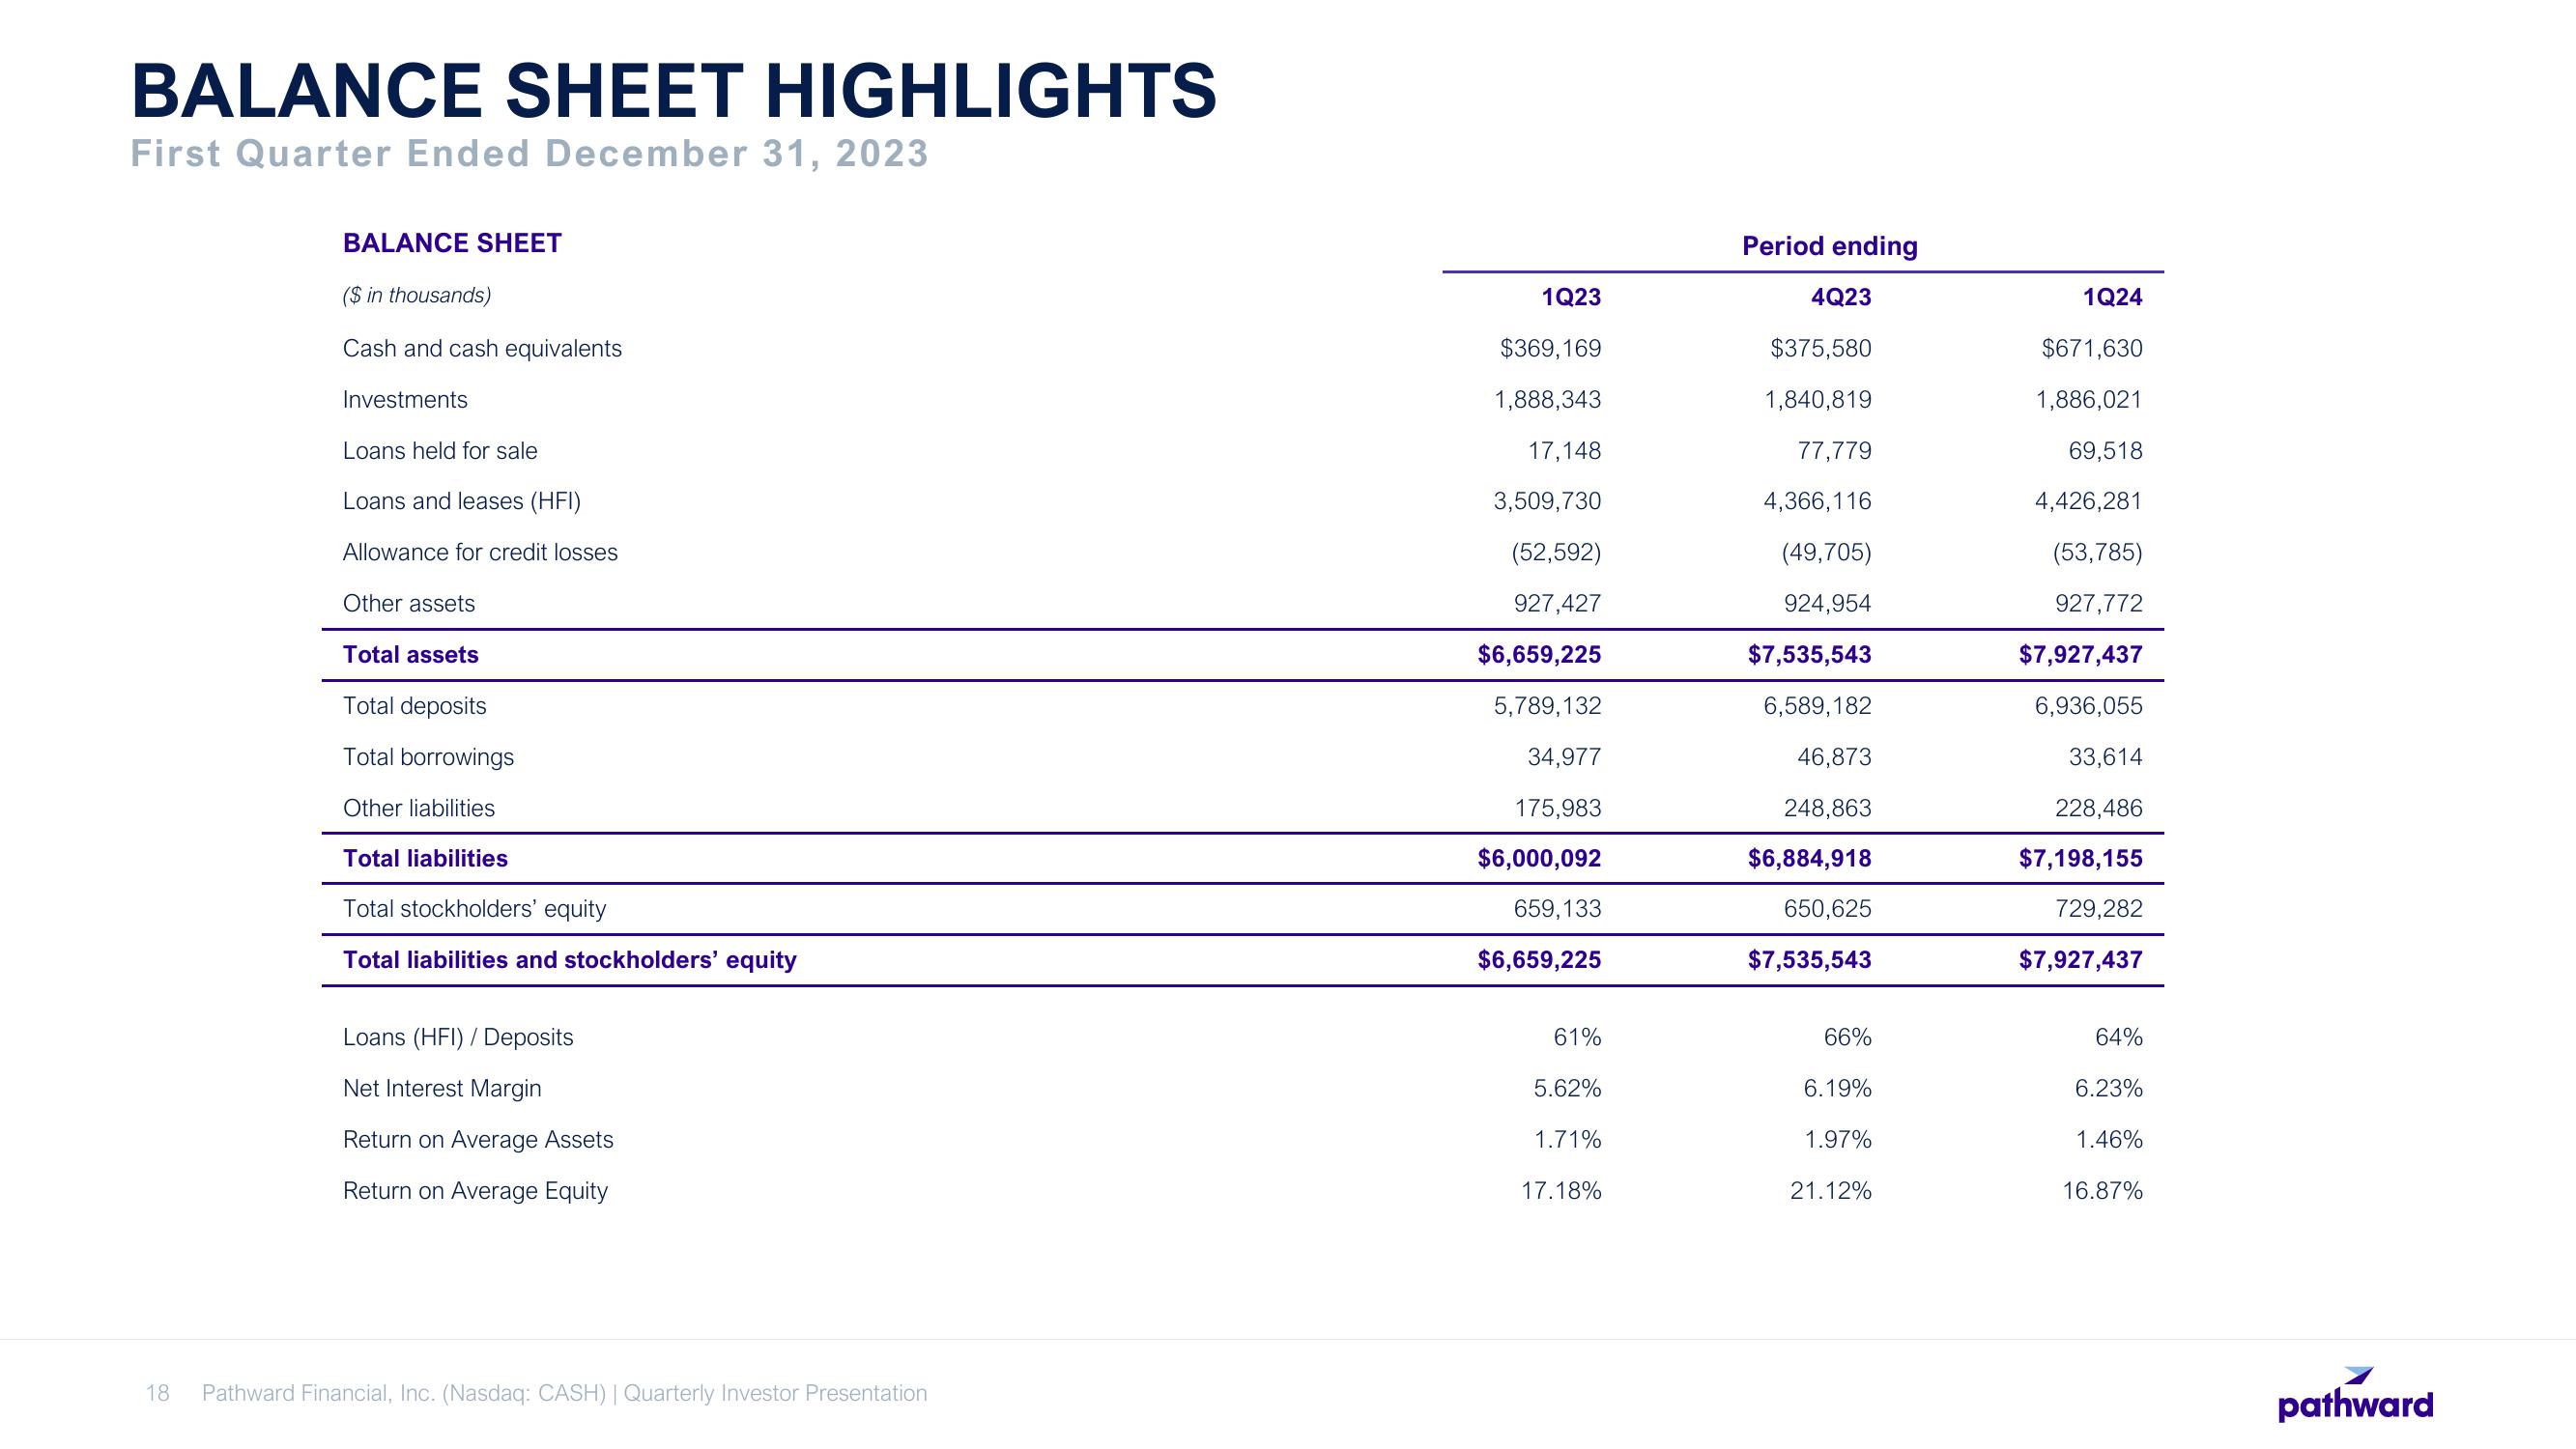
BALANCE SHEET HIGHLIGHTS
First Quarter Ended December 31, 2023
BALANCE SHEET
($ in thousands)
Cash and cash equivalents
Investments
Loans held for sale
Loans and leases (HFI)
Allowance for credit losses
Other assets
Total assets
Total deposits
Total borrowings
Other liabilities
Total liabilities
Total stockholders' equity
Total liabilities and stockholders' equity
Loans (HFI) / Deposits
Net Interest Margin
Return on Average Assets
Return on Average Equity
18 Pathward Financial, Inc. (Nasdaq: CASH) | Quarterly Investor Presentation
1Q23
$369,169
1,888,343
17,148
3,509,730
(52,592)
927,427
$6,659,225
5,789,132
34,977
175,983
$6,000,092
659,133
$6,659,225
61%
5.62%
1.71%
17.18%
Period ending
4Q23
$375,580
1,840,819
77,779
4,366,116
(49,705)
924,954
$7,535,543
6,589,182
46,873
248,863
$6,884,918
650,625
$7,535,543
66%
6.19%
1.97%
21.12%
1Q24
$671,630
1,886,021
69,518
4,426,281
(53,785)
927,772
$7,927,437
6,936,055
33,614
228,486
$7,198,155
729,282
$7,927,437
64%
6.23%
1.46%
16.87%
pathwardView entire presentation