BAT Results Presentation Deck
FY 2020: Building A Better Tomorrow™
glo
BAT
A BETTER TOMORROW
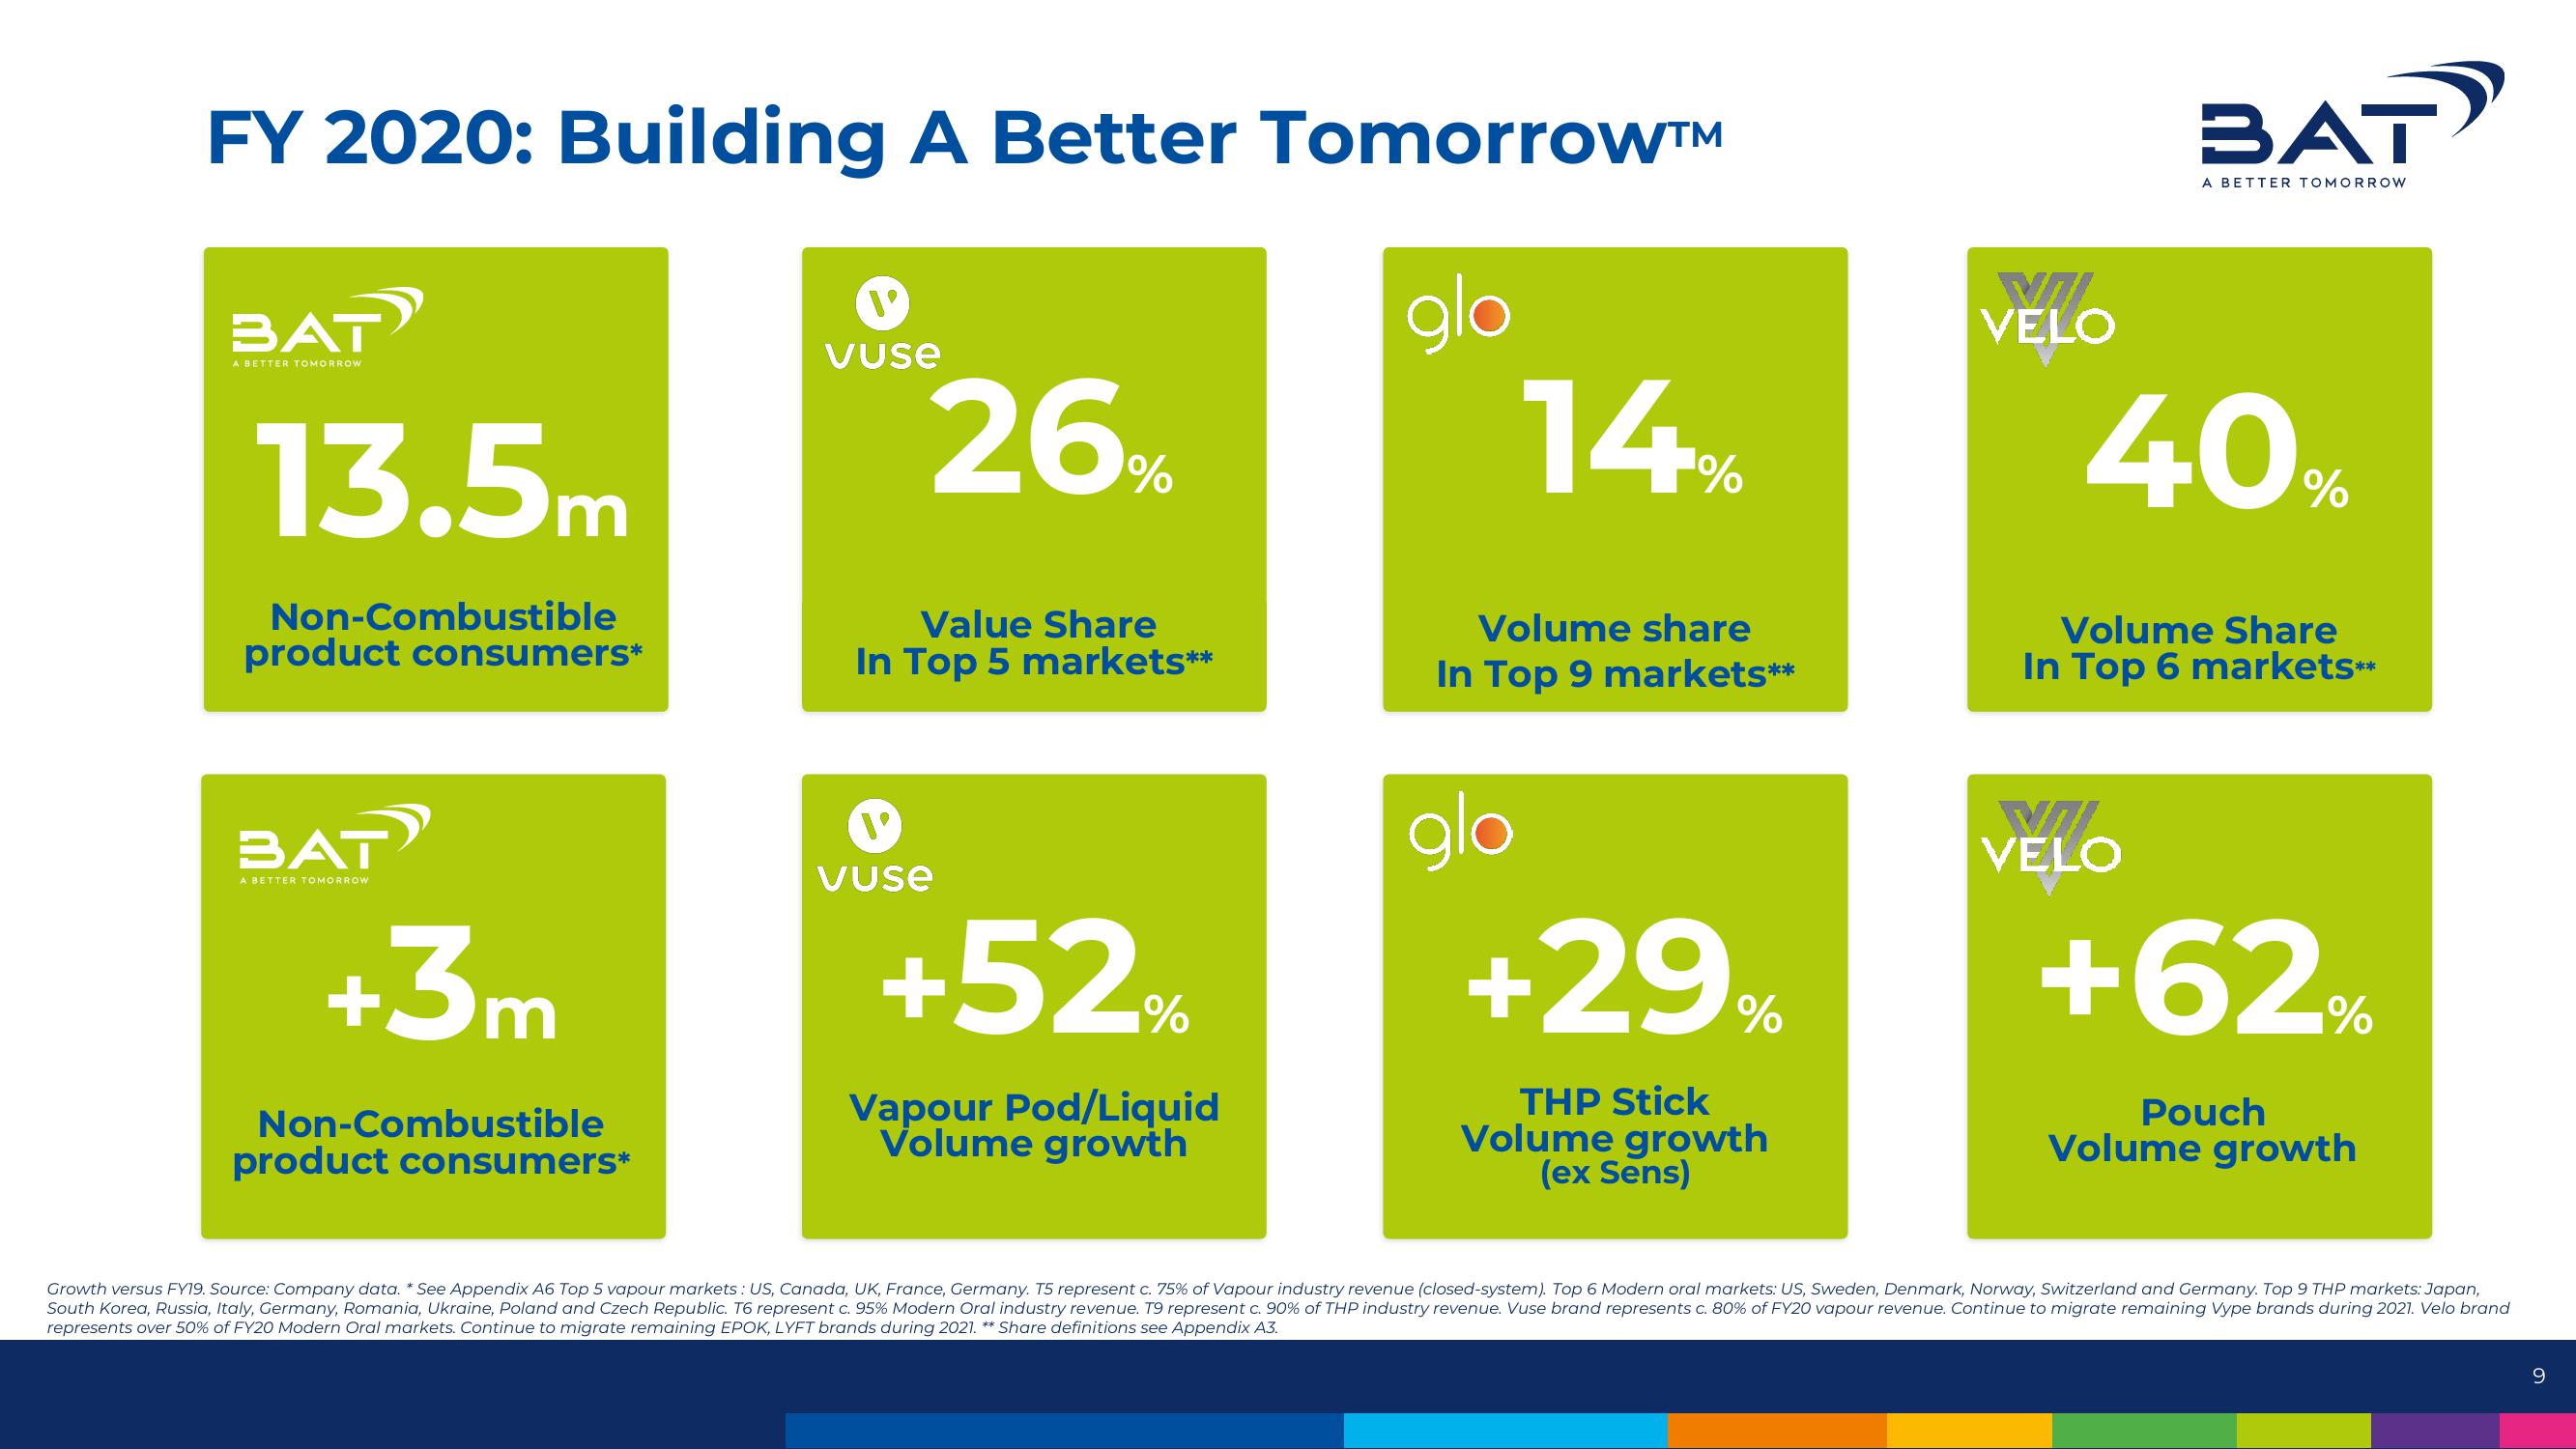
13.5m
Non-Combustible
product consumers*
BAT
A BETTER TOMORROW
+3m
Non-Combustible
product consumers*
V
vuse
26%
Value Share
In Top 5 markets**
Vuse
+52%
Vapour Pod/Liquid
Volume growth
14
%
Volume share
In Top 9 markets**
glo
+29%
THP Stick
Volume growth
(ex Sens)
VII
VELO
BAT
VELO
A BETTER TOMORROW
40%
Volume Share
In Top 6 markets**
+62%
Pouch
Volume growth
Growth versus FY19. Source: Company data. * See Appendix A6 Top 5 vapour markets: US, Canada, UK, France, Germany. T5 represent c. 75% of Vapour industry revenue (closed-system). Top 6 Modern oral markets: US, Sweden, Denmark, Norway, Switzerland and Germany. Top 9 THP markets: Japan,
South Korea, Russia, Italy, Germany, Romania, Ukraine, Poland and Czech Republic. T6 represent c. 95% Modern Oral industry revenue. T9 represent c. 90% of THP industry revenue. Vuse brand represents c. 80% of FY20 vapour revenue. Continue to migrate remaining Vype brands during 2021. Velo brand
represents over 50% of FY20 Modern Oral markets. Continue to migrate remaining EPOK, LYFT brands during 2021. ** Share definitions see Appendix A3.
9View entire presentation