ZipRecruiter Investor Presentation Deck
Reconciliations of non-GAAP financial measures to the most directly comparable
GAAP measures
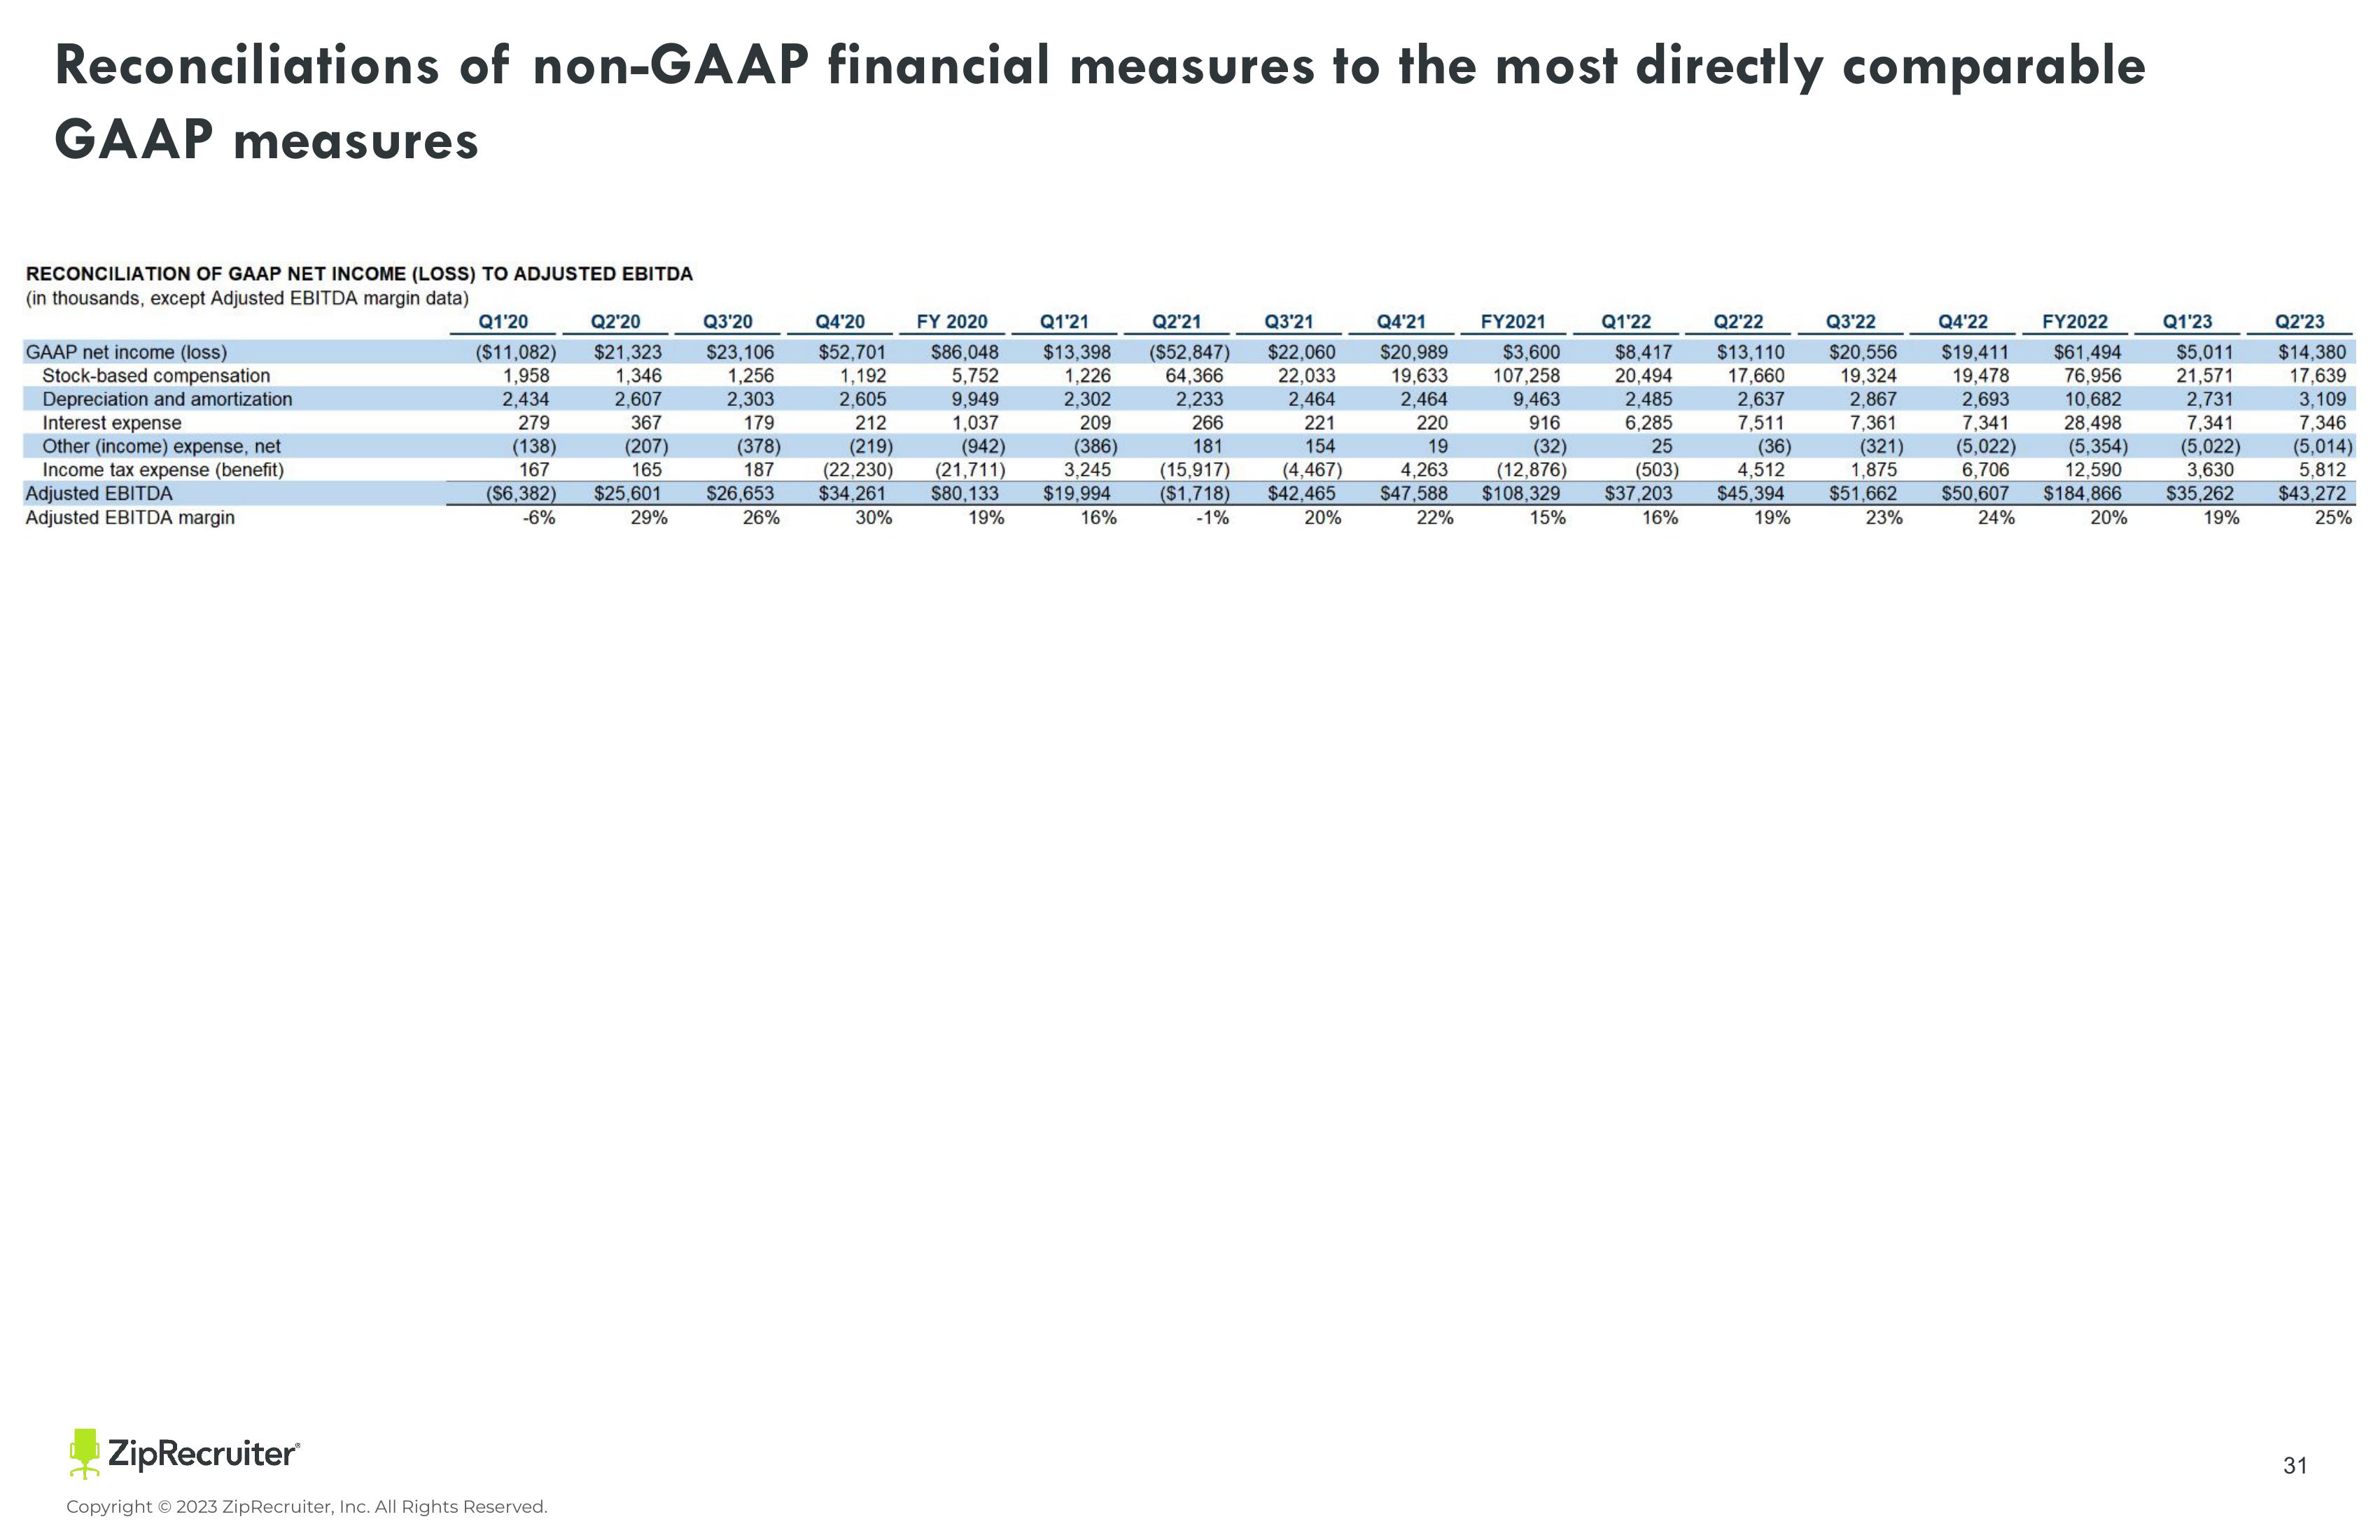
RECONCILIATION OF GAAP NET INCOME (LOSS) TO ADJUSTED EBITDA
(in thousands, except Adjusted EBITDA margin data)
GAAP net income (loss)
Stock-based compensation
Depreciation and amortization
Interest expense
Other (income) expense, net
Income tax expense (benefit)
Adjusted EBITDA
Adjusted EBITDA margin
Q1'20
Q2'20
Q3'20
($11,082) $21,323 $23,106
1,958
1,346
1,256
2,303
2,434
2,607
279
367
179
(138)
(207)
167
165
(378)
187
$26,653
26%
($6,382) $25,601
-6%
29%
ZipRecruiter
Copyright © 2023 ZipRecruiter, Inc. All Rights Reserved.
Q4'20
$52,701
1,192
2,605
212
(219)
(22,230)
$34,261
30%
FY 2020
$86,048
5,752
9,949
1,037
(942)
(21,711)
$80,133
19%
Q1'21
$13,398
1,226
2,302
209
(386)
3,245
$19,994
16%
Q2'21
Q3'21
($52,847) $22,060
64,366
2,233
22,033
2,464
221
154
266
181
(15,917)
($1,718)
-1%
(4,467)
$42.465
20%
Q1'22
Q2'22
Q3'22
Q4'22
FY2022
$8,417 $13,110 $20,556 $19,411 $61,494
FY2021
Q4'21
$20,989
$3,600
19,633 107,258 20,494 17,660
2,464
9,463
2,485
2,637
220
916 6,285
7,511
19
(32)
25
(36)
4,263
(12,876)
(503) 4,512
$47,588 $108,329 $37,203 $45,394
22%
19%
15%
16%
Q1'23
Q2'23
$5,011
$14,380
21,571
17,639
3,109
19,324 19,478 76,956
2,867
2,693 10,682 2,731
7,361
7,341 28,498
7,341
7,346
(321) (5,022) (5,354) (5,022) (5,014)
1,875
6,706 12,590
3,630
5,812
$51,662 $50,607 $184,866
$35,262 $43,272
23%
20%
19%
25%
24%
31View entire presentation