Credit Suisse Investment Banking Pitch Book
CONFIDENTIAL
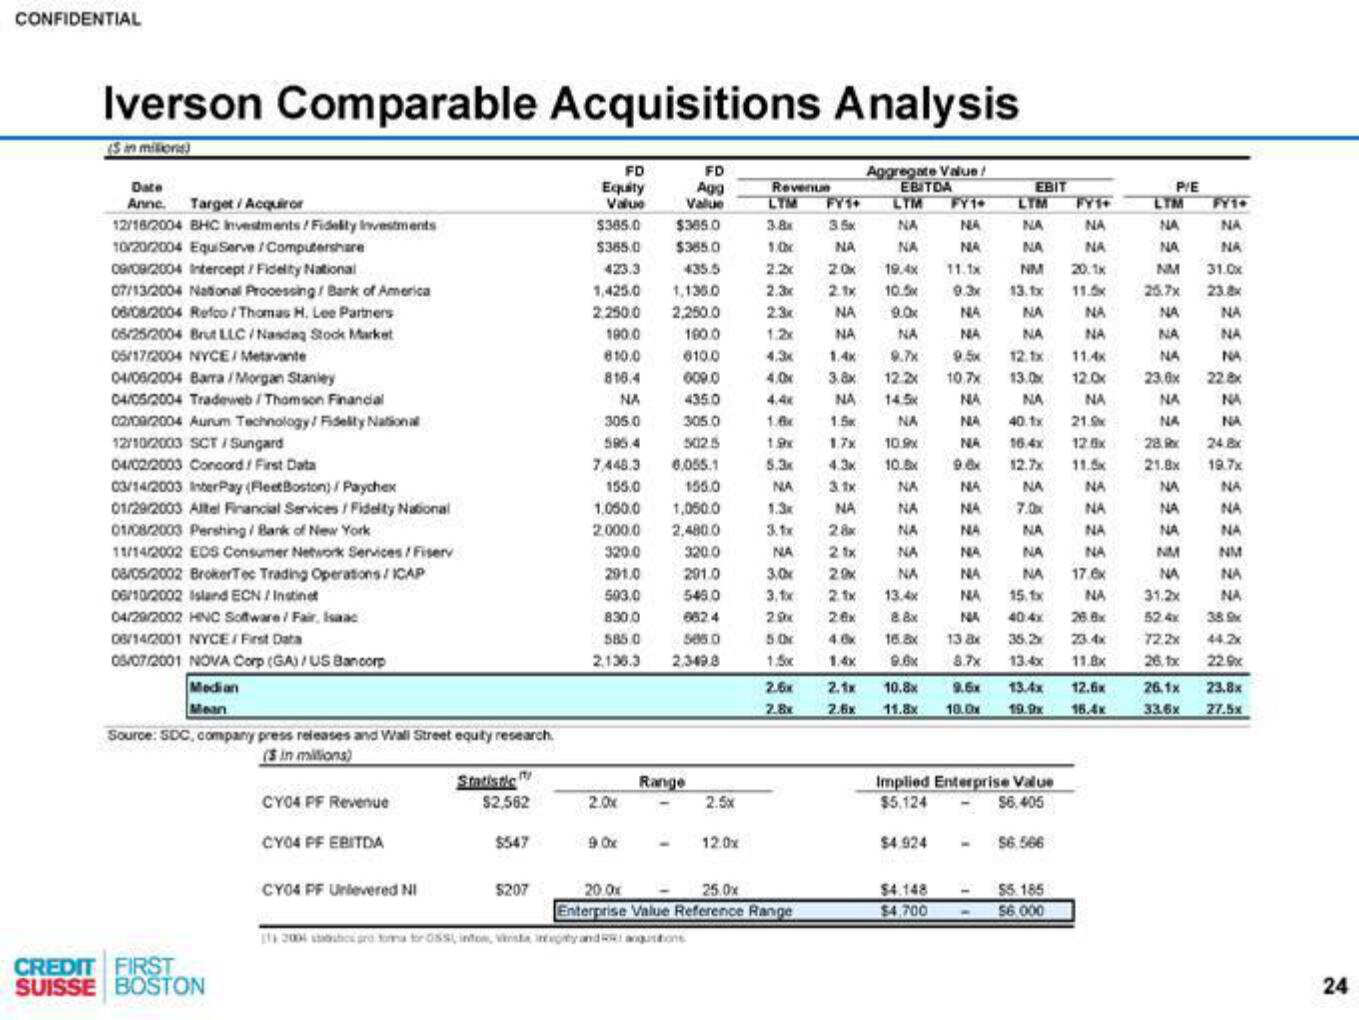
Iverson Comparable Acquisitions Analysis
(Sin miliona)
Date
Anne. Target /Acquiror
12/16/2004 BHC Investments/Fidelity Investments
10/20/2004 Equi Serve/Computershare
09/09/2004 Intercept/ Fidelity National
07/13/2004 National Processing / Bark of America
06/08/2004 Refco/Thomas H. Lee Partners
05/25/2004 Brut LLC/Nasdaq Stock Market
05/17/2004 NYCE/Metavate
04/06/2004 Barra/Morgan Stanley
04/05/2004 Tradeweb/Thomson Financial
02/09/2004 Aurum Technology/ Fidelity National
12/10/2003 SCT/Sungard
04/02/2003 Concord/ First Data
03/14/2003 InterPay (Fleet Boston)/ Paychex
01/29/2003 Altel Financial Services/Fidelity National
01/08/2003 Pershing / Bank of New York
11/14/2002 ECS Consumer Network Services/Fiserv
08/05/2002 BrokerTec Trading Operations/ICAP
06/10/2002 Island ECN/Instinct
04/29/2002 HNC Software/Fair, Isaac
06/14/2001 NYCE/ First Data
05/07/2001 NOVA Corp (GA)/US Bancorp
Median
Mean
Source: SDC, company press releases and Wall Street equity research.
(Sin millions)
CREDIT FIRST
SUISSE BOSTON
CY04 PF Revenue
CY04 PF EBITDA
CY04 PF Unlevered NI
Statistic
$2,562
$547
$207
FD
Equity
Value
$385.0
$365.0
423.3
1,425.0
2.250.0
190.0
810.0
816.4
NA
305.0
596.4
7,448.3
155.0
1,050.0
2.000.0
320.0
291.0
503.0
830.0
585.0
2,136.3
2.0x
90x
FD
Agg
Value
$385.0
$365.0
435.5
1,136.0
2,250.0
190.0
610.0
009.0
435.0
305.0
502.5
6,055.1
155.0
1,050.0
2,480.0
320.0
291.0
549.0
682.4
505.0
2.349.8
Range
2.5x
2004 tubes gro torna tor OSS into, Vista integy and RR angustions
12.0x
Revenue
LTM FY1+
3.8x
1.0x
2.2x
2.3x
2.3x
1.2x
4.3x
4,0x
1.6
1.9x
5.3x
NA
1.3k
3.1x
NA
3.0
3.1x
2.9x
5.0k
1.5xx
2.6x
2.8x
200x
25.0x
Enterprise Value Reference Range
Aggregate Value
EBITDA
LTM FY1
LYM
FY1+
NA
NA
NA
3.5x NA
NA NA
20x 19.4x 11.1x
NA
NA
NM
NA
20.1x
2.1x 10 9.3x 13.1x 11
NA
NA
NA 9.0x
NA
NA
1.4x 9.7x
3.8x 12-2x
Th
NA
1.5K
NA
NA
NA
NA
9.5x 12.1x 11.4x
10.7x 13.0x 12.0x
NA NA
NA 40.1x
NA
9.0x
NA
NA
21.9
1.7x
4.3k
NA
10.9x
10.8x
16.4x 17x
12.7x 1
NA
3.1x
NA
NA
NA
NA
NA
7.0x
NA
28x
NA
NA
NA
NA
21x
NA
NA
2.9x
NA
2.1x
26x
4.0x
NA
NA
13 Bx
8.7x 13.4x
9.6x 13.4x 12.6x
1.4x
11.8x 10.0x 19.9x 16.4x
NA
NA
13.4x
8.8x
16.8x
9.6x
2.1x 10.8x
2.5x
EBIT
NA
NA 17.6x
NA
28.8x
23.4x
11.8x
$4.148
$4.700
15.1x
40.4x
Implied Enterprise Value
$5,124
56,405
$4.924 - 56.566
$5.185
56.000
P/E
LTM FY1
NA
NA
NM
25.7x
NA
NA
NA
23.0x
NA
NA
28.x 24.8x
21.8x 19.7x
NA
NA
NA
NM
NA
31.2x
52.4x
72,2x
26.tx
NA
NA
31.0x
23.8x
NA
NA
NA
22.8x
NA
26.1x
33.6x
NA
NA
NA
NM
NA
NA
389x
44.2x
22.9x
23.8x
7.50
24View entire presentation