PJT Partners Investment Banking Pitch Book
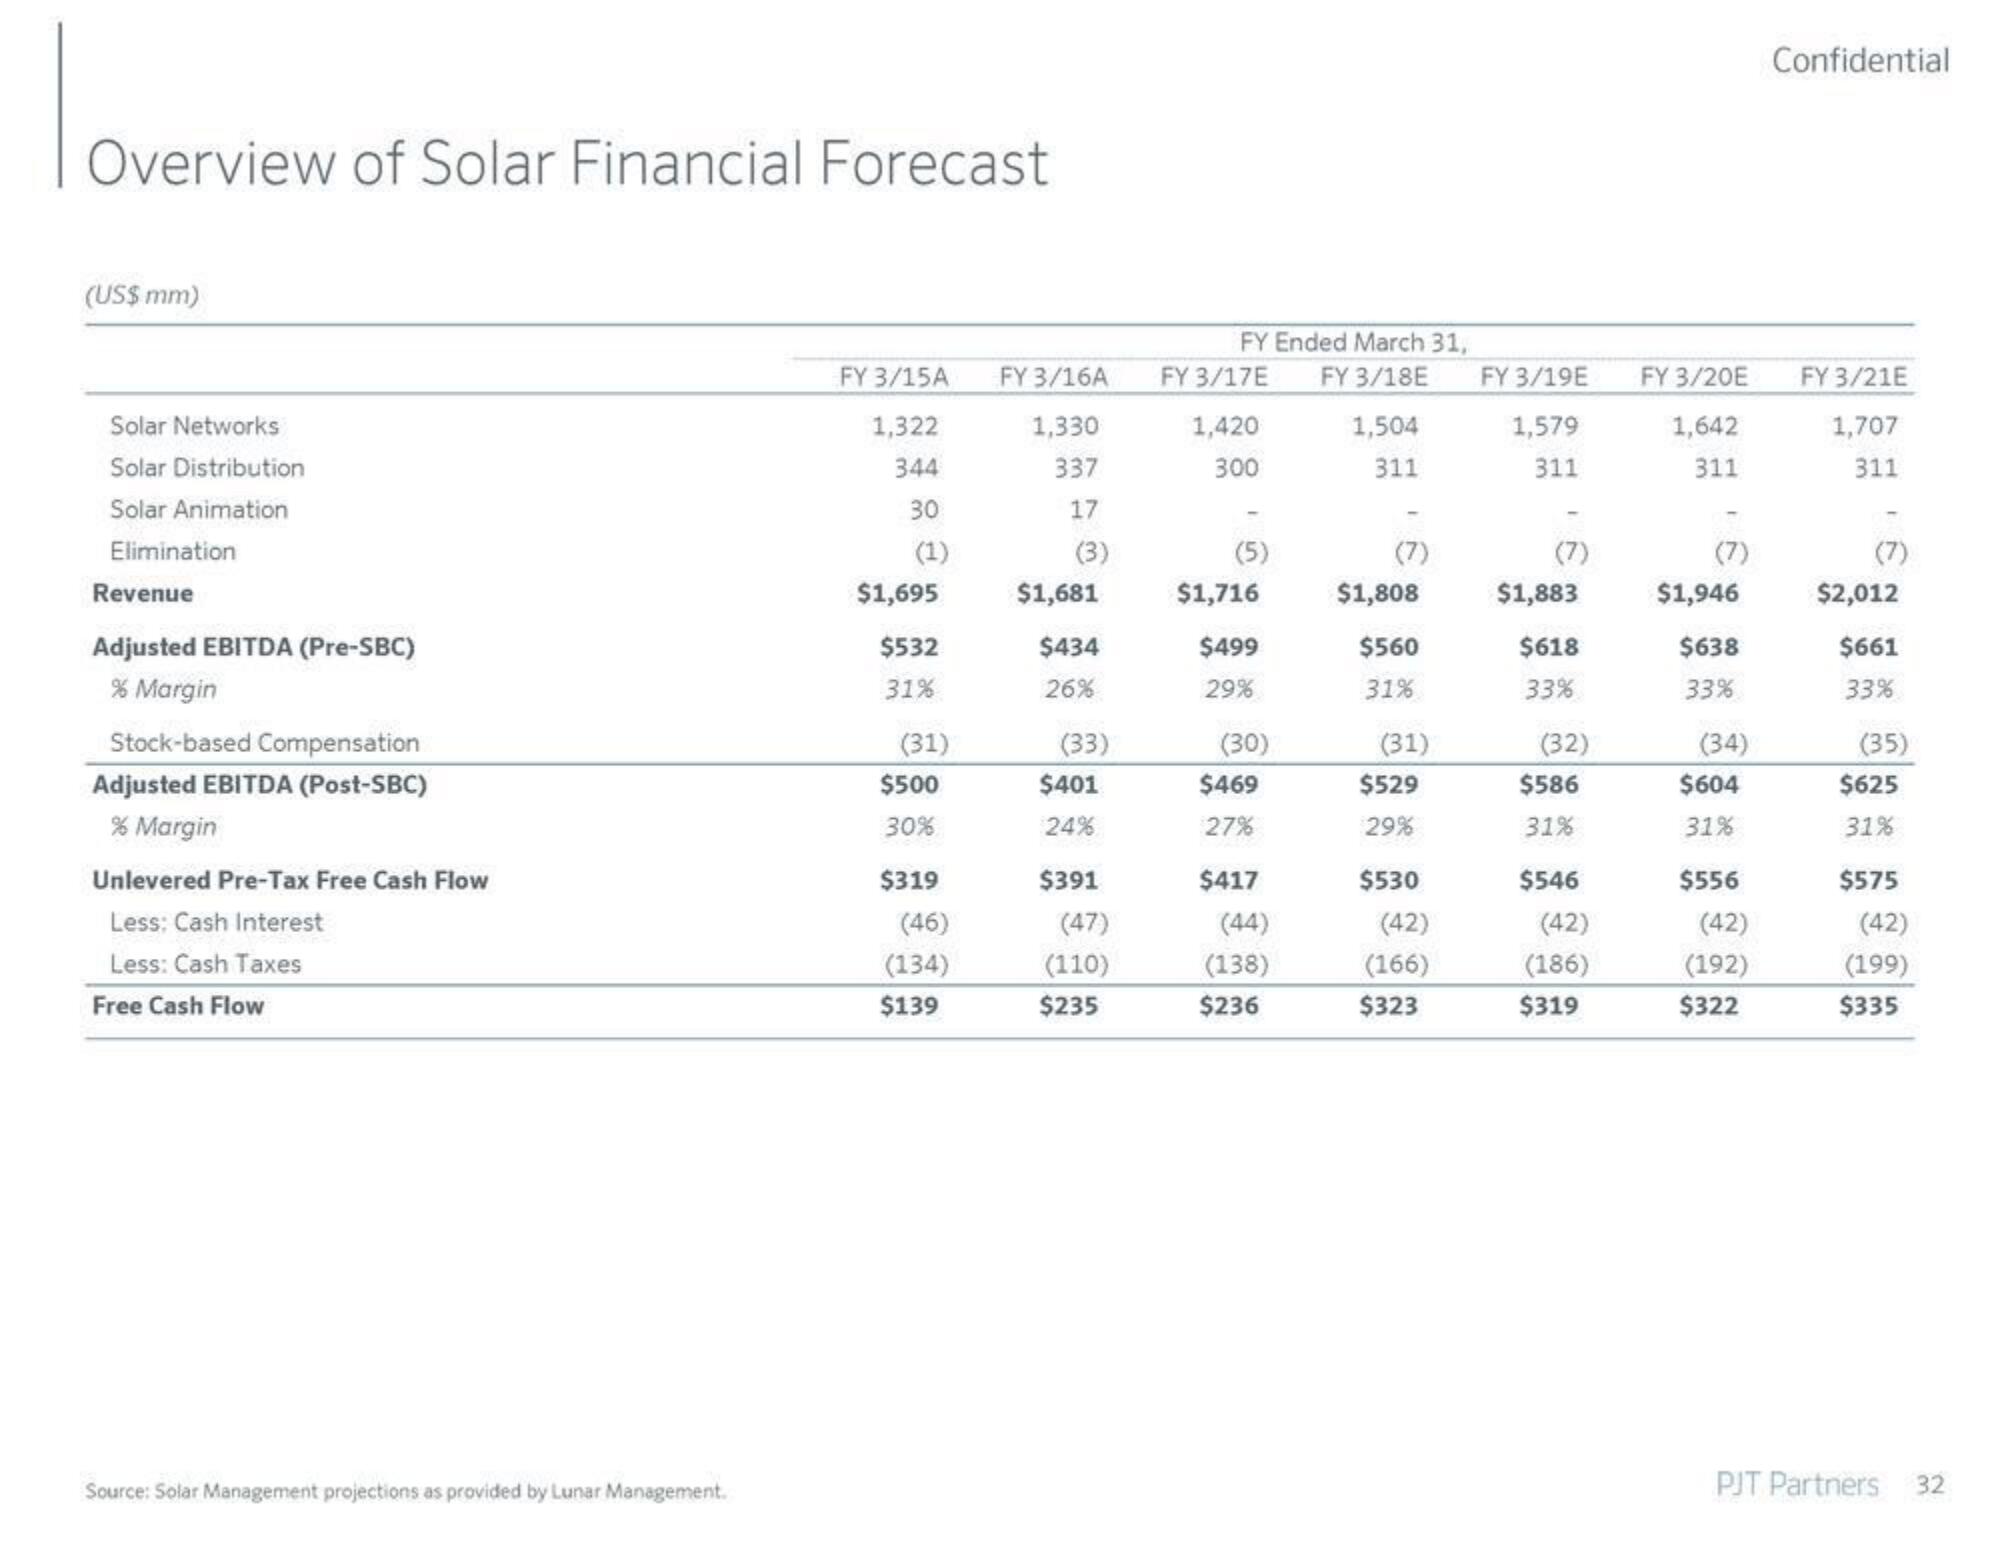
Overview of Solar Financial Forecast
(US$ mm)
Solar Networks
Solar Distribution
Solar Animation
Elimination
Revenue
Adjusted EBITDA (Pre-SBC)
% Margin
Stock-based Compensation
Adjusted EBITDA (Post-SBC)
% Margin
Unlevered Pre-Tax Free Cash Flow
Less: Cash Interest
Less: Cash Taxes
Free Cash Flow
Source: Solar Management projections as provided by Lunar Management.
FY 3/15A
1,322
344
30
(1)
$1,695
$532
31%
(31)
$500
30%
$319
(46)
(134)
$139
FY 3/16A
1,330
337
17
(3)
$1,681
$434
26%
(33)
$401
24%
$391
(47)
(110)
$235
FY Ended March 31,
FY 3/17E FY 3/18E
1,420
300
(5)
$1,716
$499
29%
(30)
$469
27%
$417
(44)
(138)
$236
1,504
311
(7)
$1,808
$560
31%
(31)
$529
29%
$530
(42)
(166)
$323
FY 3/19E FY 3/20E
1,579
1,642
311
311
(7)
$1,883
$618
33%
(32)
$586
31%
$546
(42)
(186)
$319
(7)
$1,946
$638
33%
(34)
$604
31%
$556
(42)
(192)
$322
Confidential
FY 3/21E
1,707
311
(7)
$2,012
$661
33%
(35)
$625
31%
$575
(42)
(199)
$335
PJT Partners
32View entire presentation