Uber Results Presentation Deck
Uber Delivery ex-US &
Canada is growing
much faster than peers
Q2'21 GB/GMV/
GOV/GTV annualized
scale & growth
85%
YoY
72% 58%
YoY YoY
Uber
26%
YoY
Q2 2021 Earnings
104% 70%
YOY
YoY
$52B $39B $39B $35B $26B $25B $9B
E
8
Uber ROW
Delivery
----------
76%
YoY
Uber US&C
Delivery
Delivery ex-US &
Canada near
breakeven in Q2
Q2'21 Adjusted EBITDA
loss and margin (% of
Gross Bookings)
($13M) Adj. EBITDA
(0.2%) of GBs
O
($148M) Adj. EBITDA
(2.4%) of GBs
Uber US&C Delivery
1. Gross Bookings reported by Uber, Gross Merchandise Value reported by Delivery Hero, Gross Order Value reported by
Doordash, and Gross Transaction Value reported by JET and Deliveroo.
2. Uber Delivery based on Q2'21 actuals, Delivery Hero based on Q2'21 Visible Alpha consensus, DoorDash based on Q2'21 Visible
Alpha consensus, JET based on midpoint of Q2'21 guidance and YoY % based on Q2'21 actual, Deliveroo based on FY'21 Visible
Alpha consensus and YoY % based on Q2'21 actual.
3. Euro and Pound to USD currency conversions based on July 15th 2021 exchange rates.
*based on majority owned operations Gross Bookings
Uber ROW Delivery
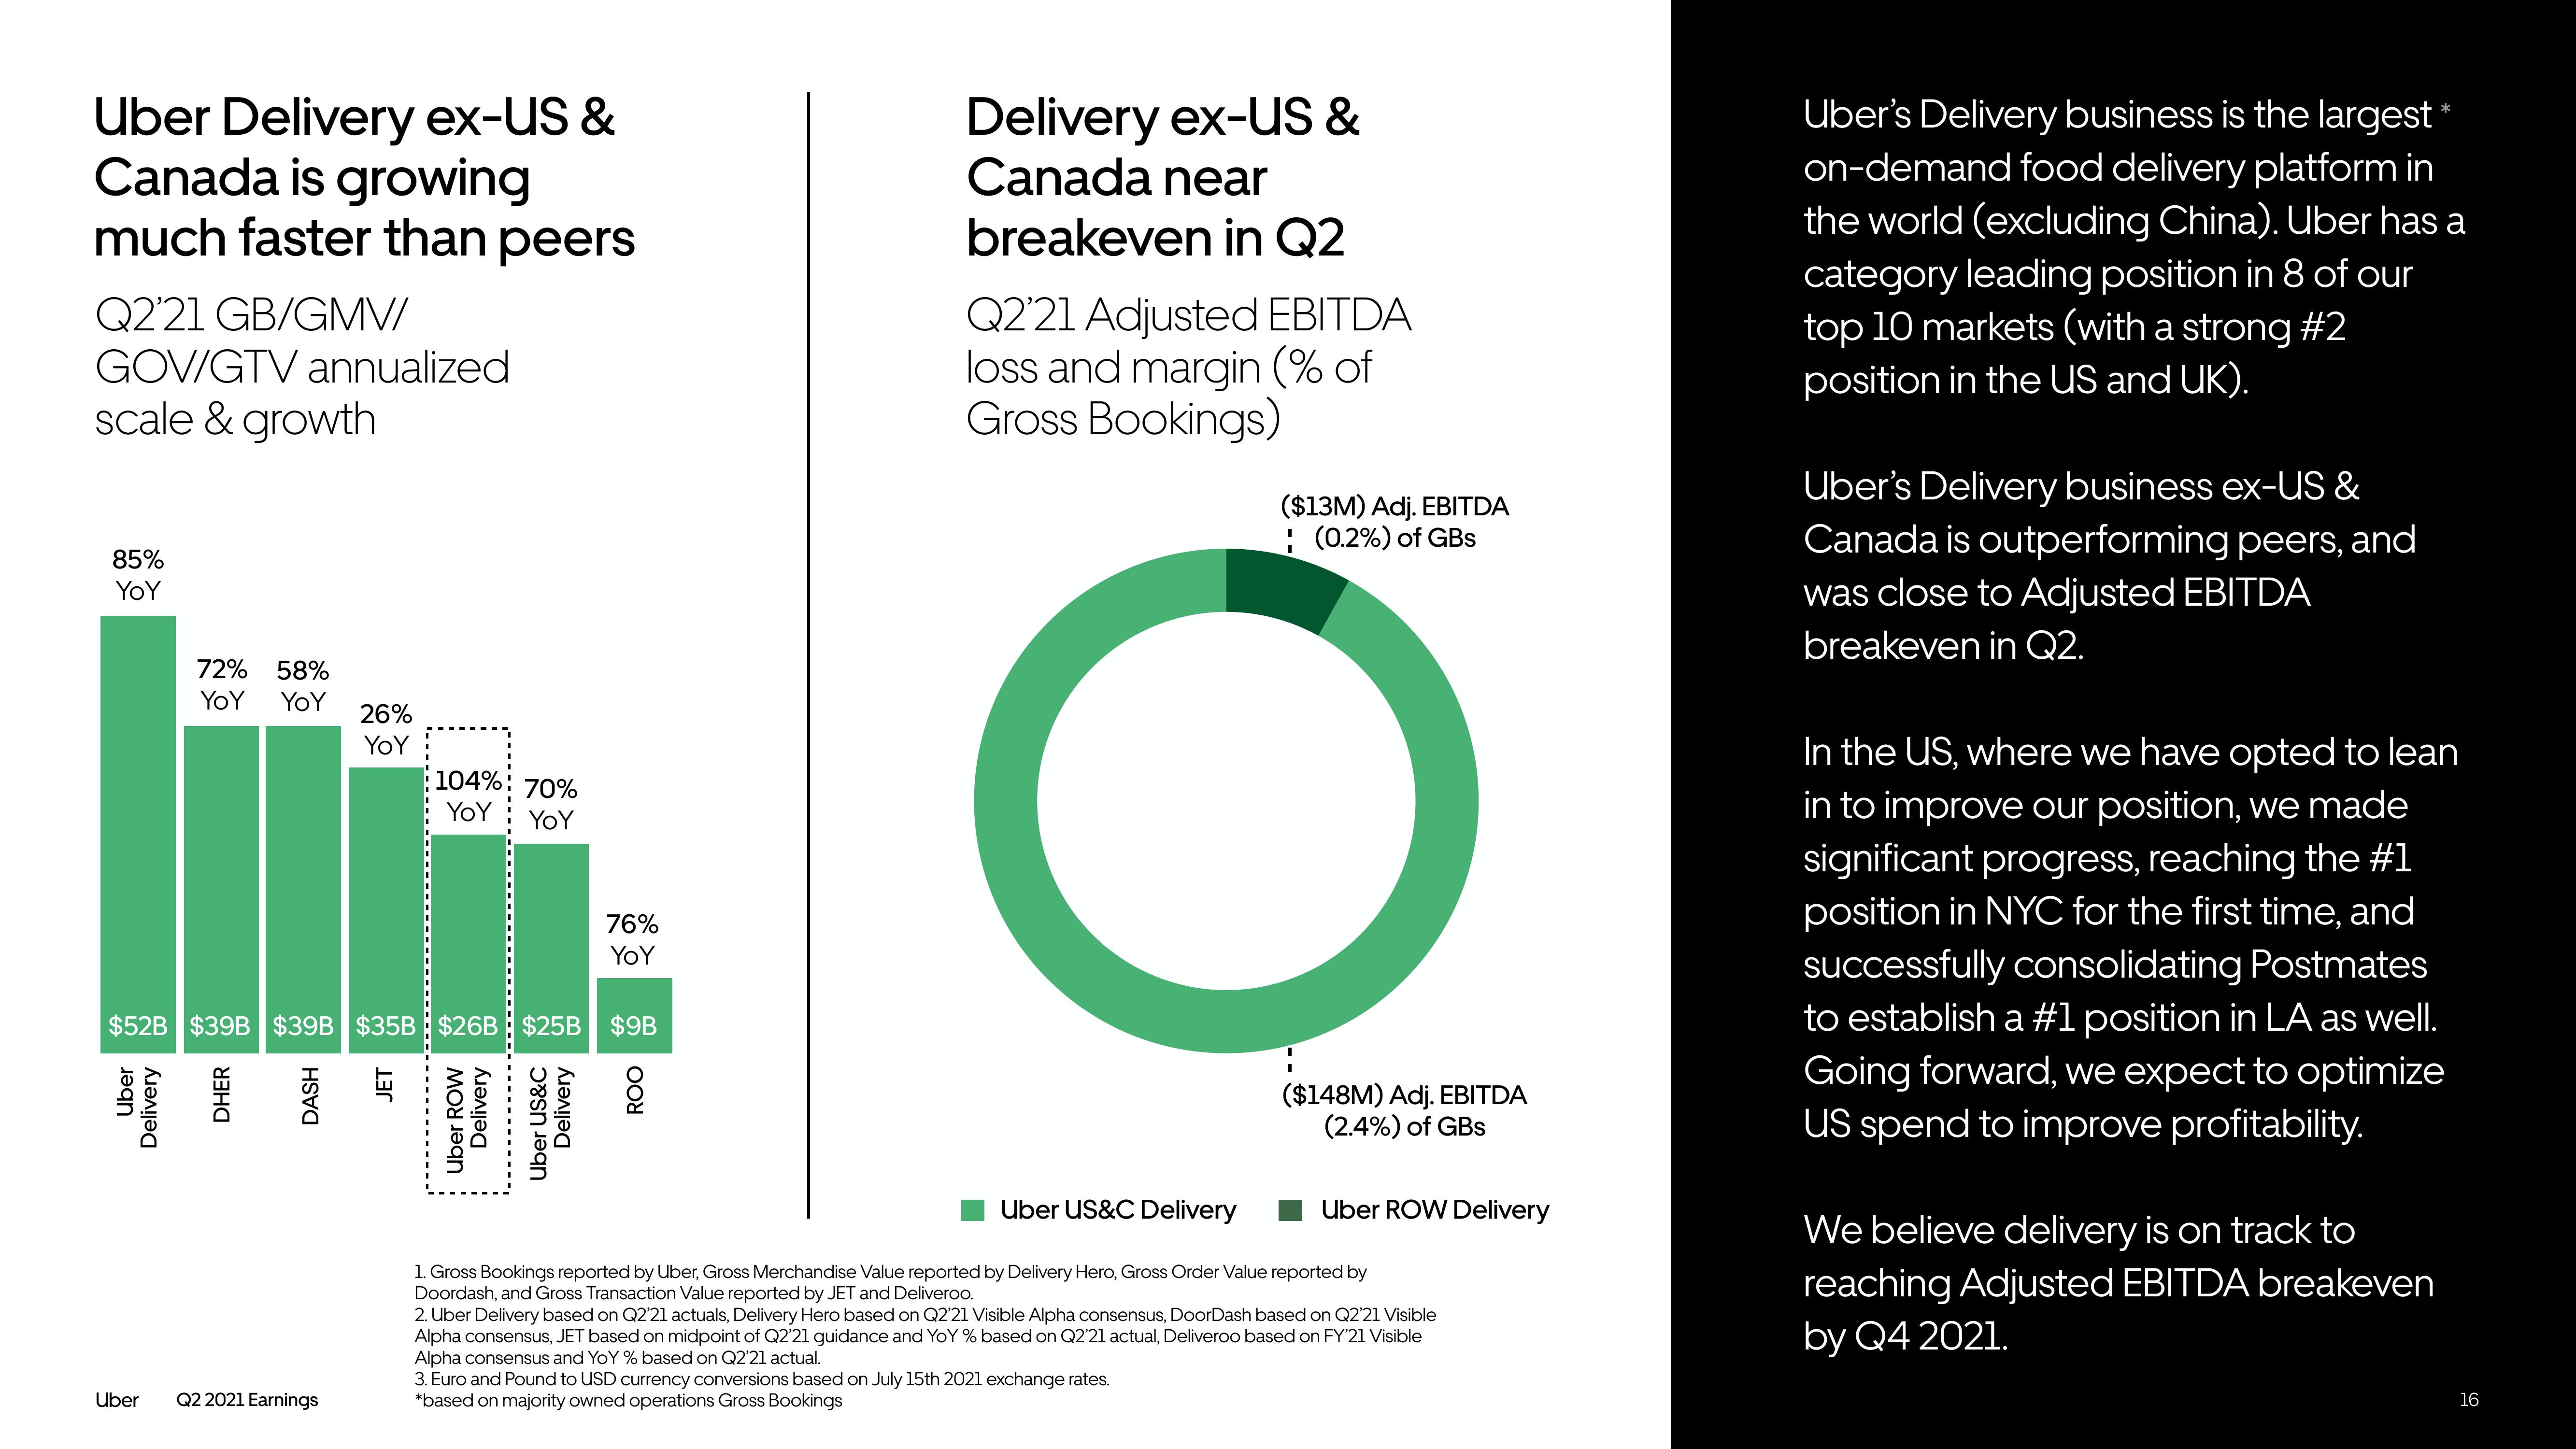
Uber's Delivery business is the largest *
on-demand food delivery platform in
the world (excluding China). Uber has a
category leading position in 8 of our
top 10 markets (with a strong #2
position in the US and UK).
Uber's Delivery business ex-US &
Canada is outperforming peers, and
was close to Adjusted EBITDA
breakeven in Q2.
In the US, where we have opted to lean
in to improve our position, we made
significant progress, reaching the #1
position in NYC for the first time, and
successfully consolidating Postmates
to establish a #1 position in LA as well.
Going forward, we expect to optimize
US spend to improve profitability.
We believe delivery is on track to
reaching Adjusted EBITDA breakeven
by Q4 2021.
16View entire presentation