Wix Results Presentation Deck
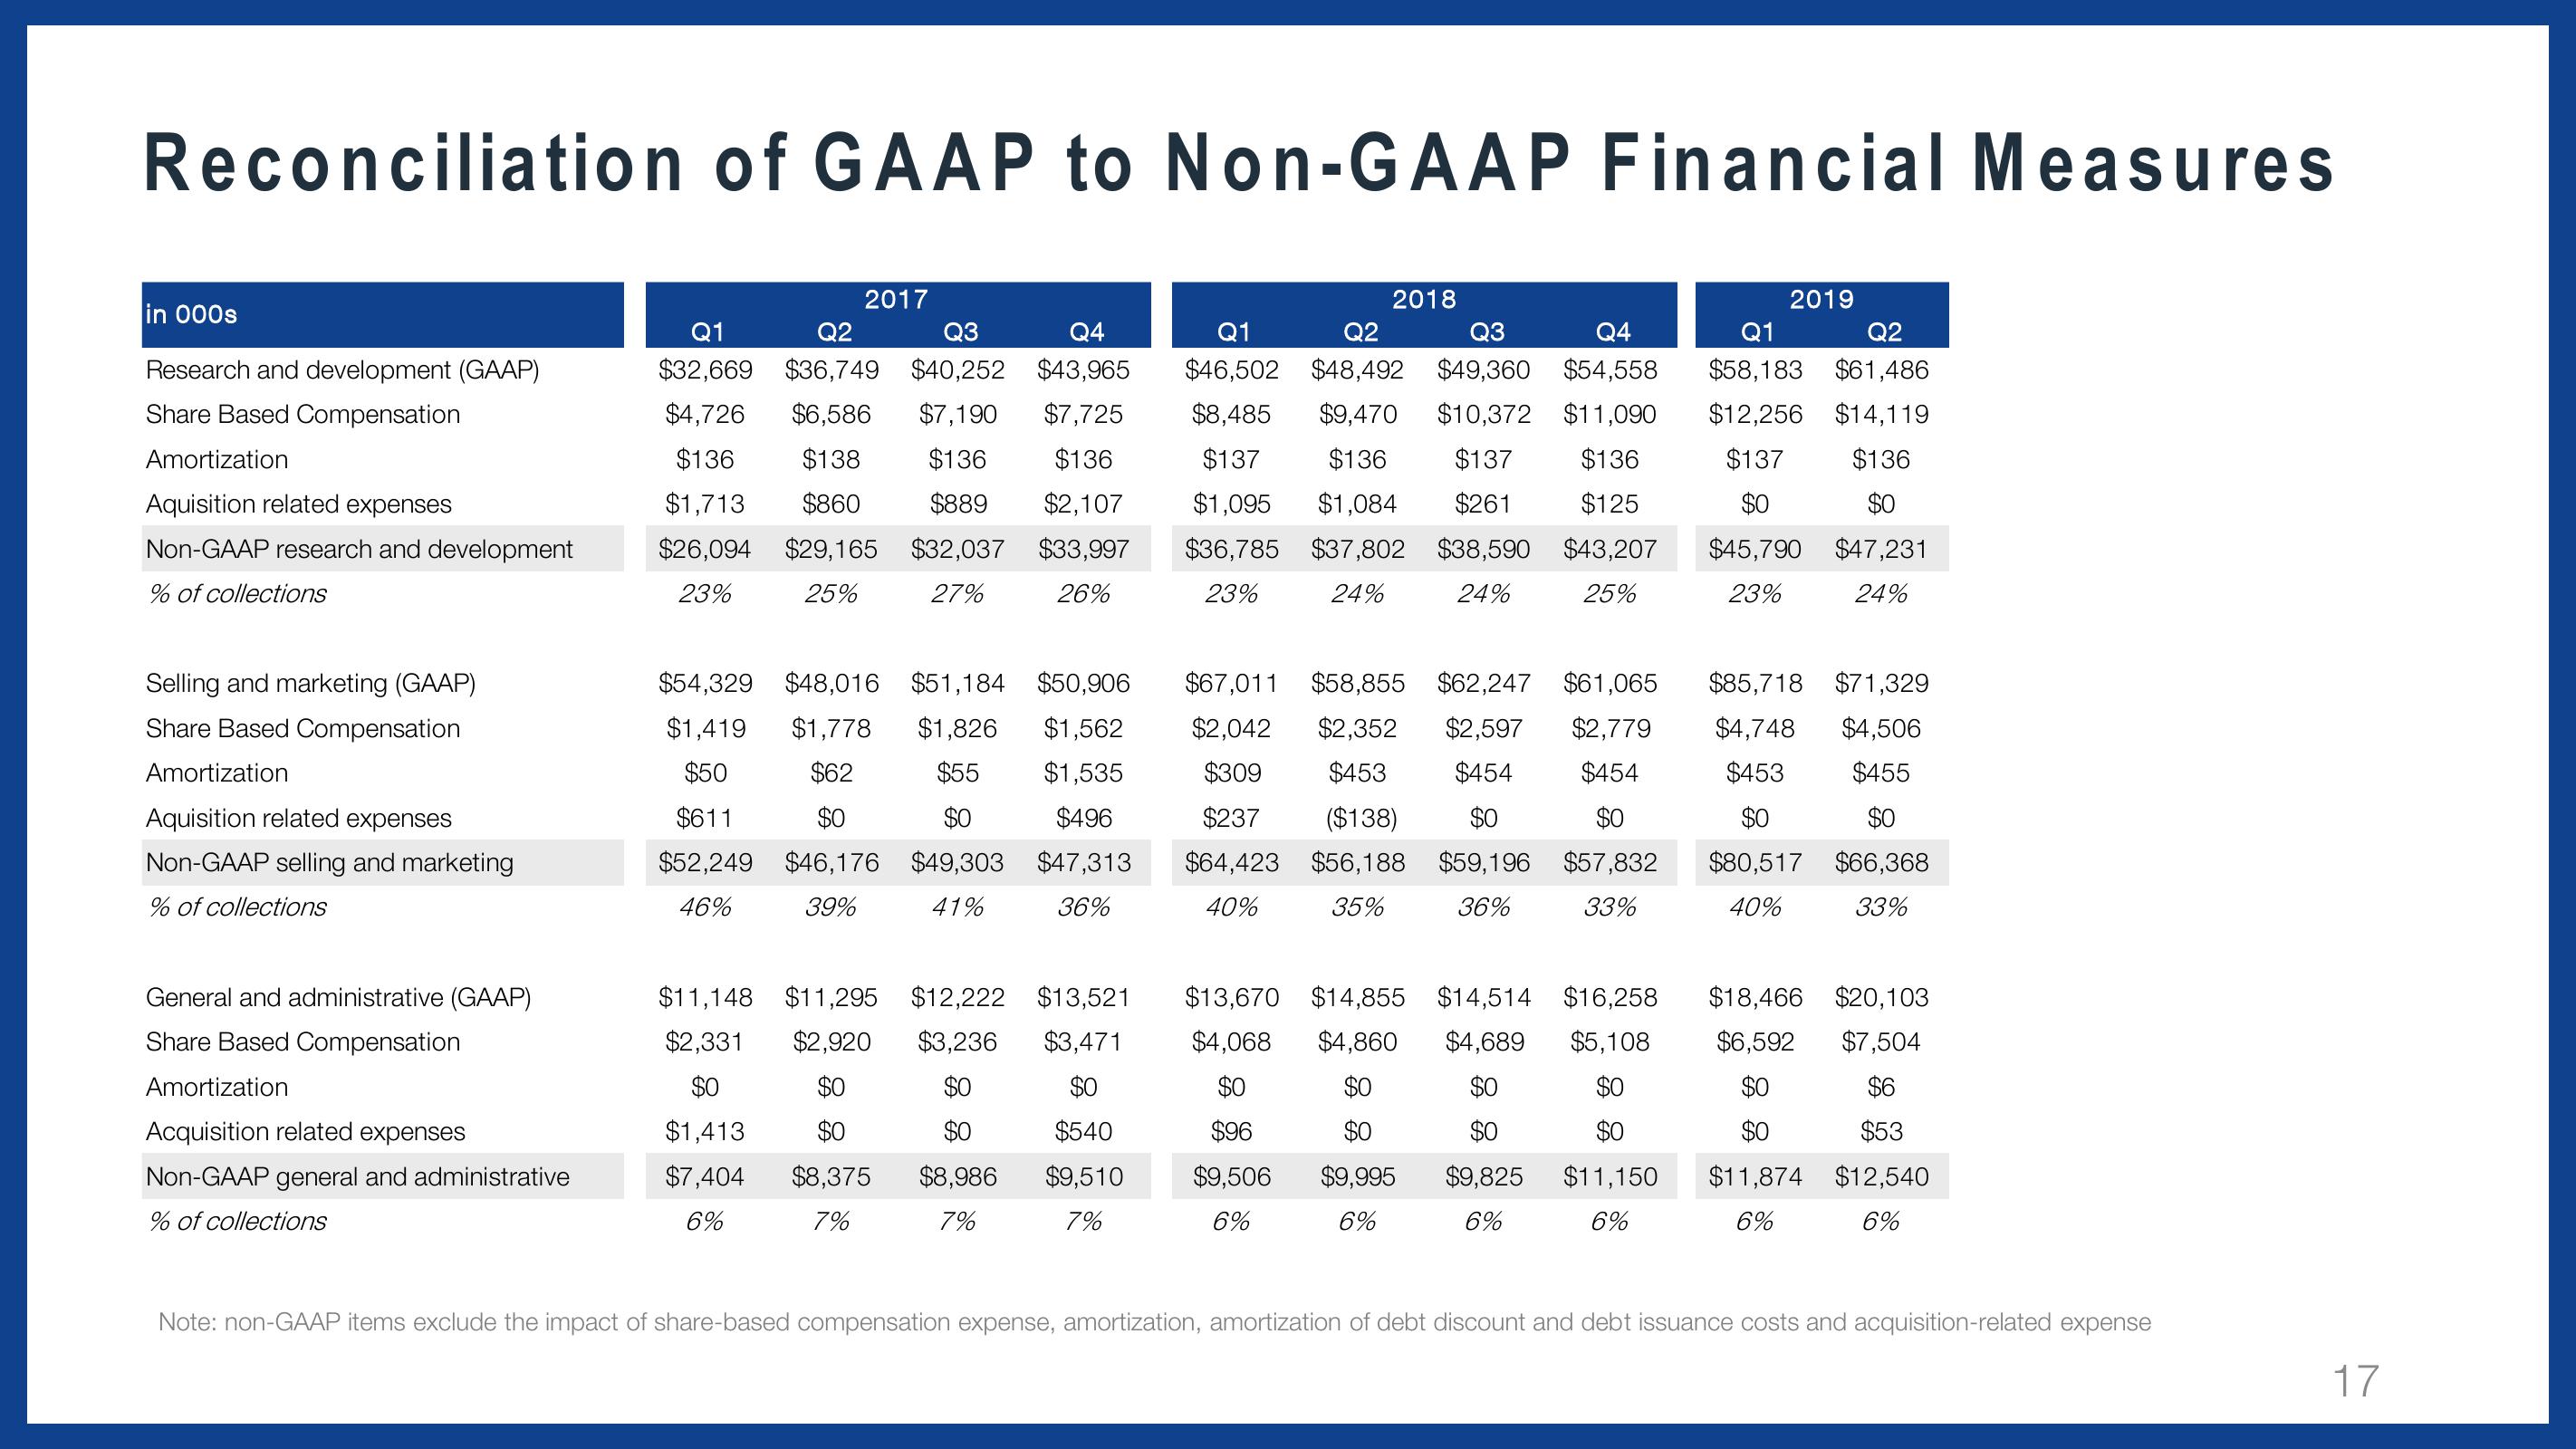
Reconciliation of GAAP to Non-GAAP Financial Measures
in 000s
Research and development (GAAP)
Share Based Compensation
Amortization
Aquisition related expenses
Non-GAAP research and development
% of collections
Selling and marketing (GAAP)
Share Based Compensation
Amortization
Aquisition related expenses
Non-GAAP selling and marketing
% of collections
General and administrative (GAAP)
Share Based Compensation
Amortization
Acquisition related expenses
Non-GAAP general and administrative
% of collections
2017
Q1
Q4
Q2
Q3
$32,669 $36,749 $40,252 $43,965
$4,726 $6,586 $7,190 $7,725
$136 $138 $136 $136
$1,713 $860 $889 $2,107
$26,094 $29,165 $32,037 $33,997
23%
25% 27% 26%
$54,329 $48,016 $51,184 $50,906
$1,419 $1,778 $1,826 $1,562
$50
$62 $55 $1,535
$611 $0
$0 $496
$52,249 $46,176 $49,303 $47,313
39% 41%
36%
46%
$11,148 $11,295 $12,222 $13,521
$2,331 $2,920 $3,236 $3,471
$0
$0
$0
$0
$1,413 $0
$0 $540
$7,404 $8,375 $8,986 $9,510
6%
7%
7%
7%
2018
Q4
Q2
Q1
Q2
Q3
Q1
$46,502 $48,492 $49,360 $54,558 $58,183 $61,486
$8,485 $9,470 $10,372 $11,090 $12,256 $14,119
$137 $136
$137
$136 $137 $136
$1,095 $1,084 $261 $125
$0
$0
$36,785 $37,802 $38,590 $43,207 $45,790 $47,231
23% 24% 24%
25%
23%
24%
$67,011 $58,855 $62,247 $61,065
$2,042 $2,352 $2,597 $2,779
$309 $453 $454 $454
$237 ($138) $0
$0
$64,423 $56,188 $59,196 $57,832
40% 35%
36% 33%
$13,670 $14,855
$4,068 $4,860
$0
$0
$96
$9,506
6%
$0
$9,995
6%
2019
$14,514 $16,258
$4,689 $5,108
$0
$0
$0
$9,825
6%
$85,718 $71,329
$4,748 $4,506
$453 $455
$0
$0
$80,517 $66,368
40% 33%
$18,466 $20,103
$6,592 $7,504
$0
$6
$0
$0 $53
$11,150 $11,874 $12,540
6%
6%
6%
Note: non-GAAP items exclude the impact of share-based compensation expense, amortization, amortization of debt discount and debt issuance costs and acquisition-related expense
17View entire presentation