jetBlue Results Presentation Deck
MAINTAINING RELATIVE BALANCE SHEET STRENGTH
jetBlue
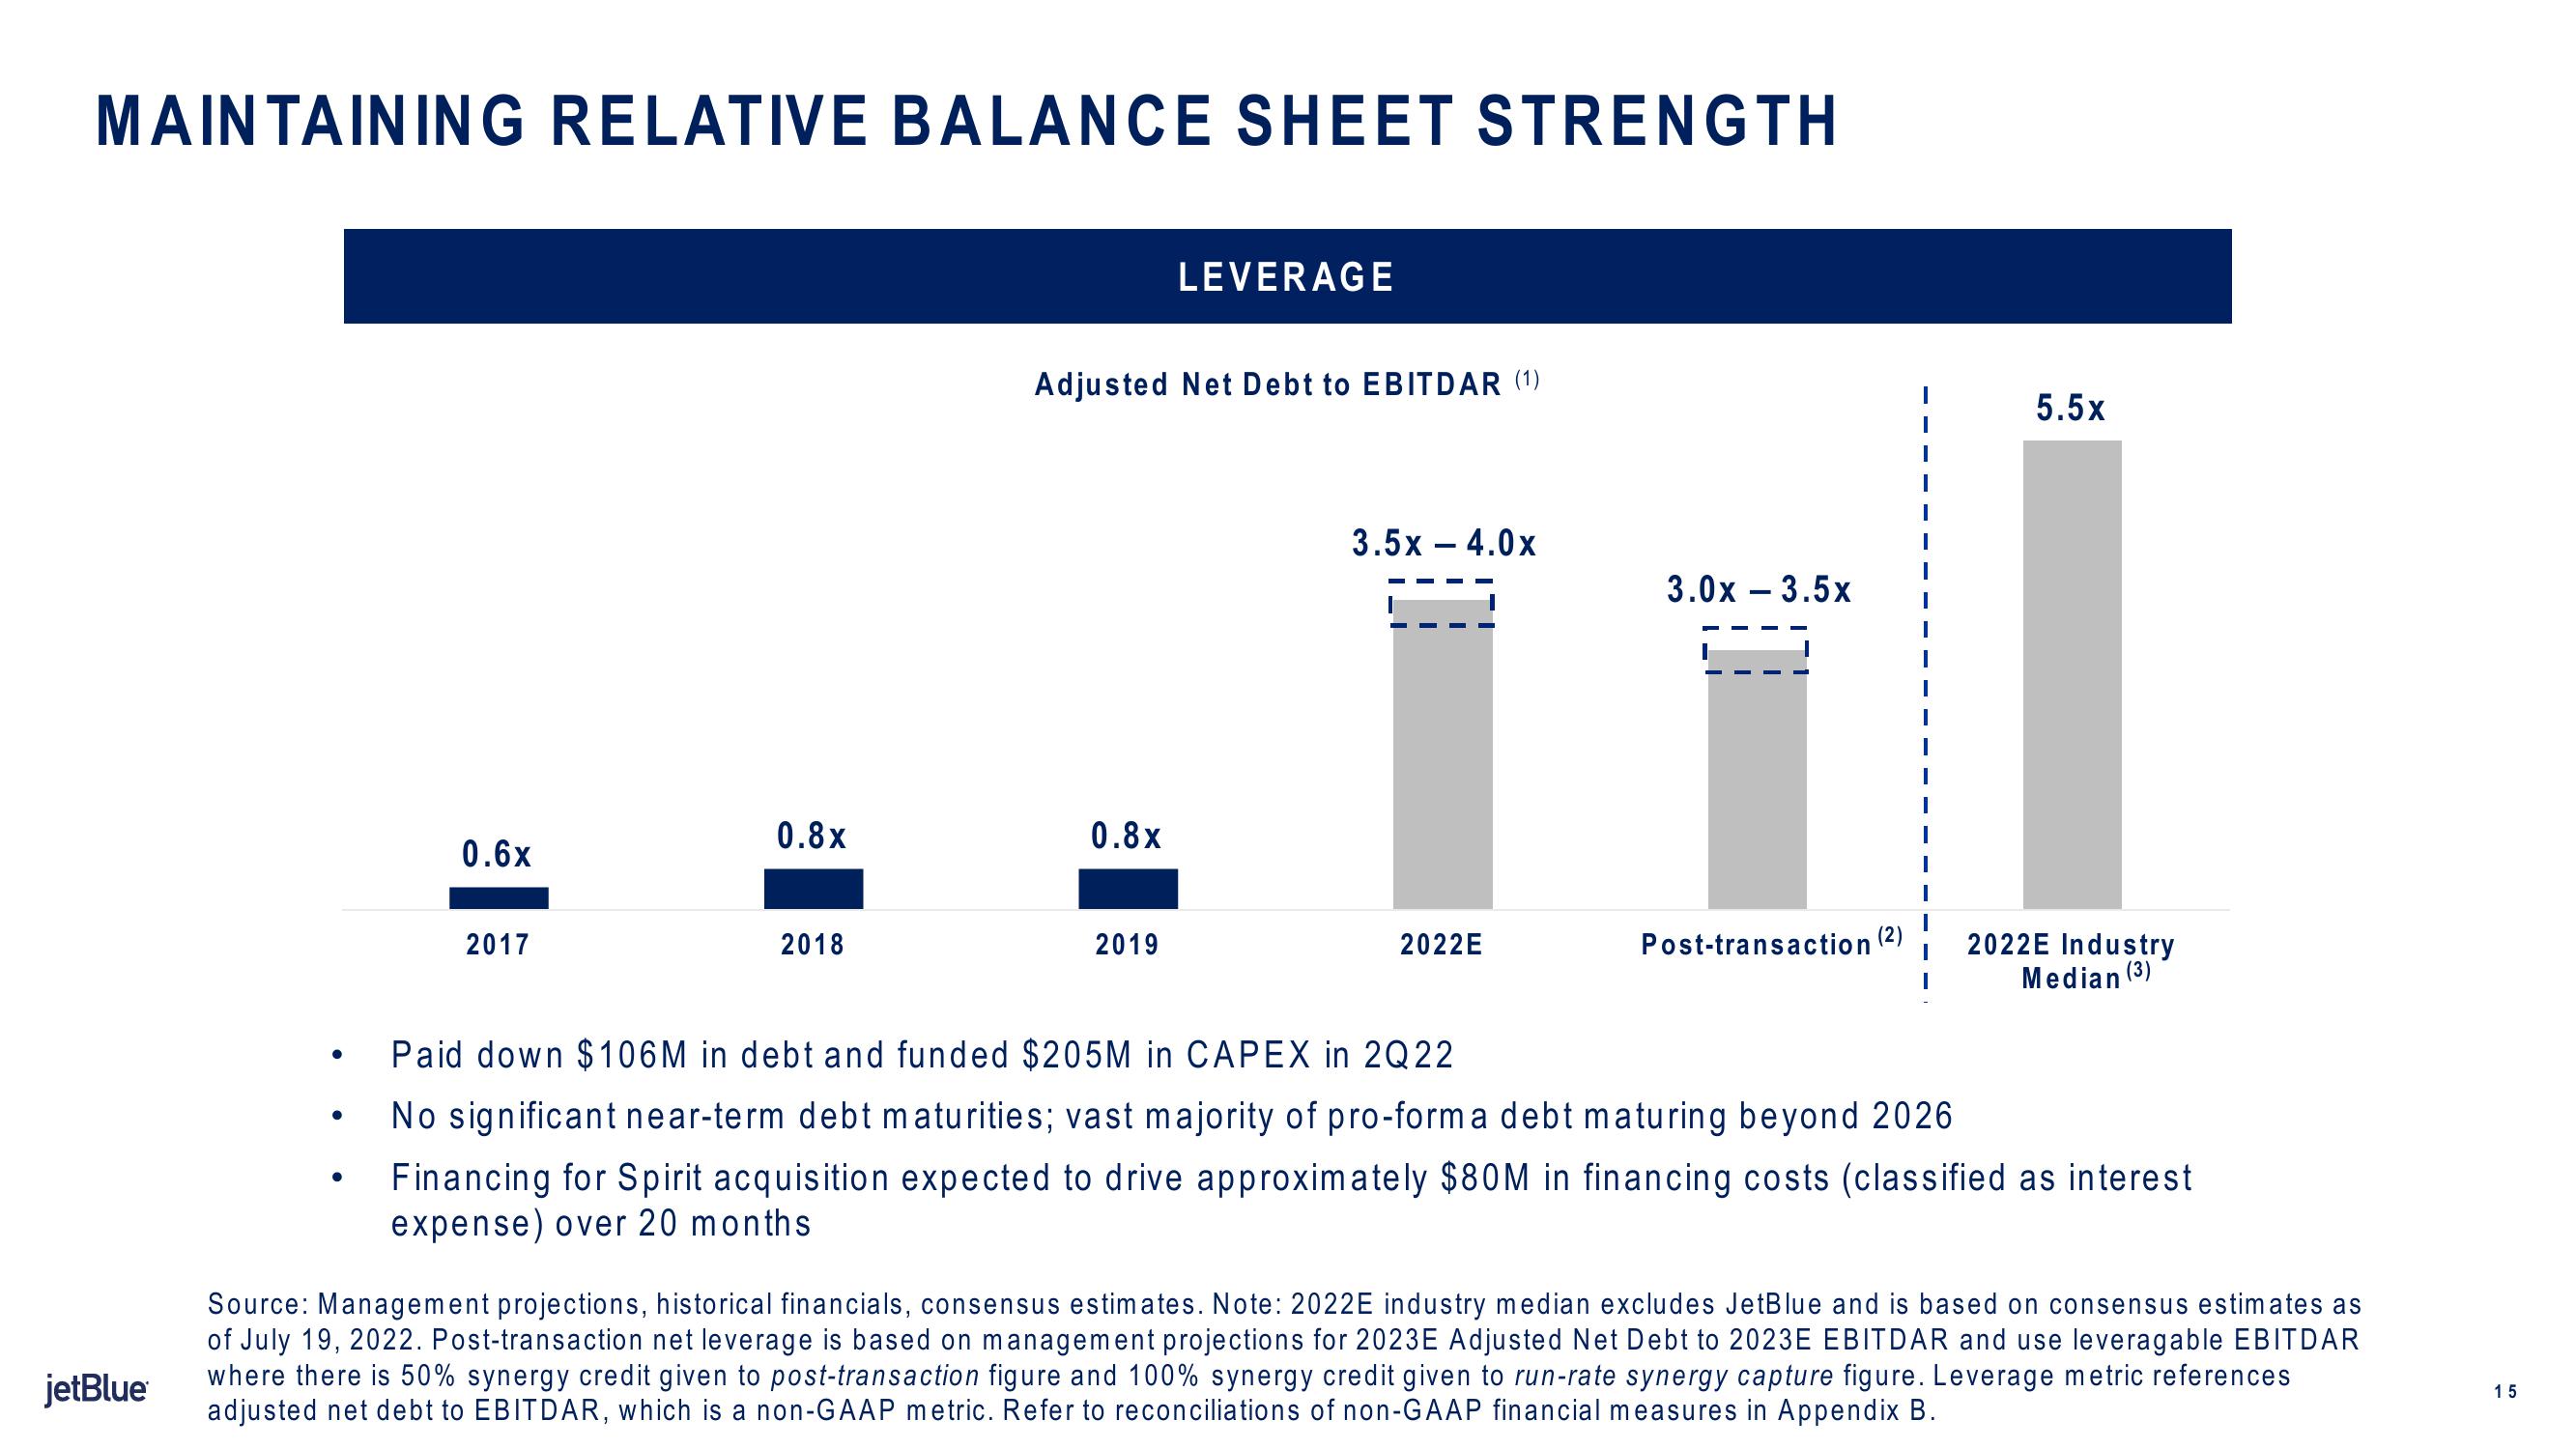
0.6x
2017
0.8x
2018
Adjusted Net Debt to EBITDAR (1)
0.8x
LEVERAGE
2019
3.5x - 4.0x
3.0x - 3.5x
ÏÏ
2022E
Post-transaction (2)
5.5x
2022E Industry
Median (3)
Paid down $106M in debt and funded $205M in CAPEX in 2Q22
No significant near-term debt maturities; vast majority of pro-form a debt maturing beyond 2026
Financing for Spirit acquisition expected to drive approximately $80M in financing costs (classified as interest
expense) over 20 months
Source: Management projections, historical financials, consensus estimates. Note: 2022E industry median excludes JetBlue and is based on consensus estimates as
of July 19, 2022. Post-transaction net leverage is based on management projections for 2023E Adjusted Net Debt to 2023E EBITDAR and use leveragable EBITDAR
where there is 50% synergy credit given to post-transaction figure and 100% synergy credit given to run-rate synergy capture figure. Leverage metric references
adjusted net debt to EBITDAR, which is a non-GAAP metric. Refer to reconciliations of non-GAAP financial measures in Appendix B.
15View entire presentation