DigitalOcean Results Presentation Deck
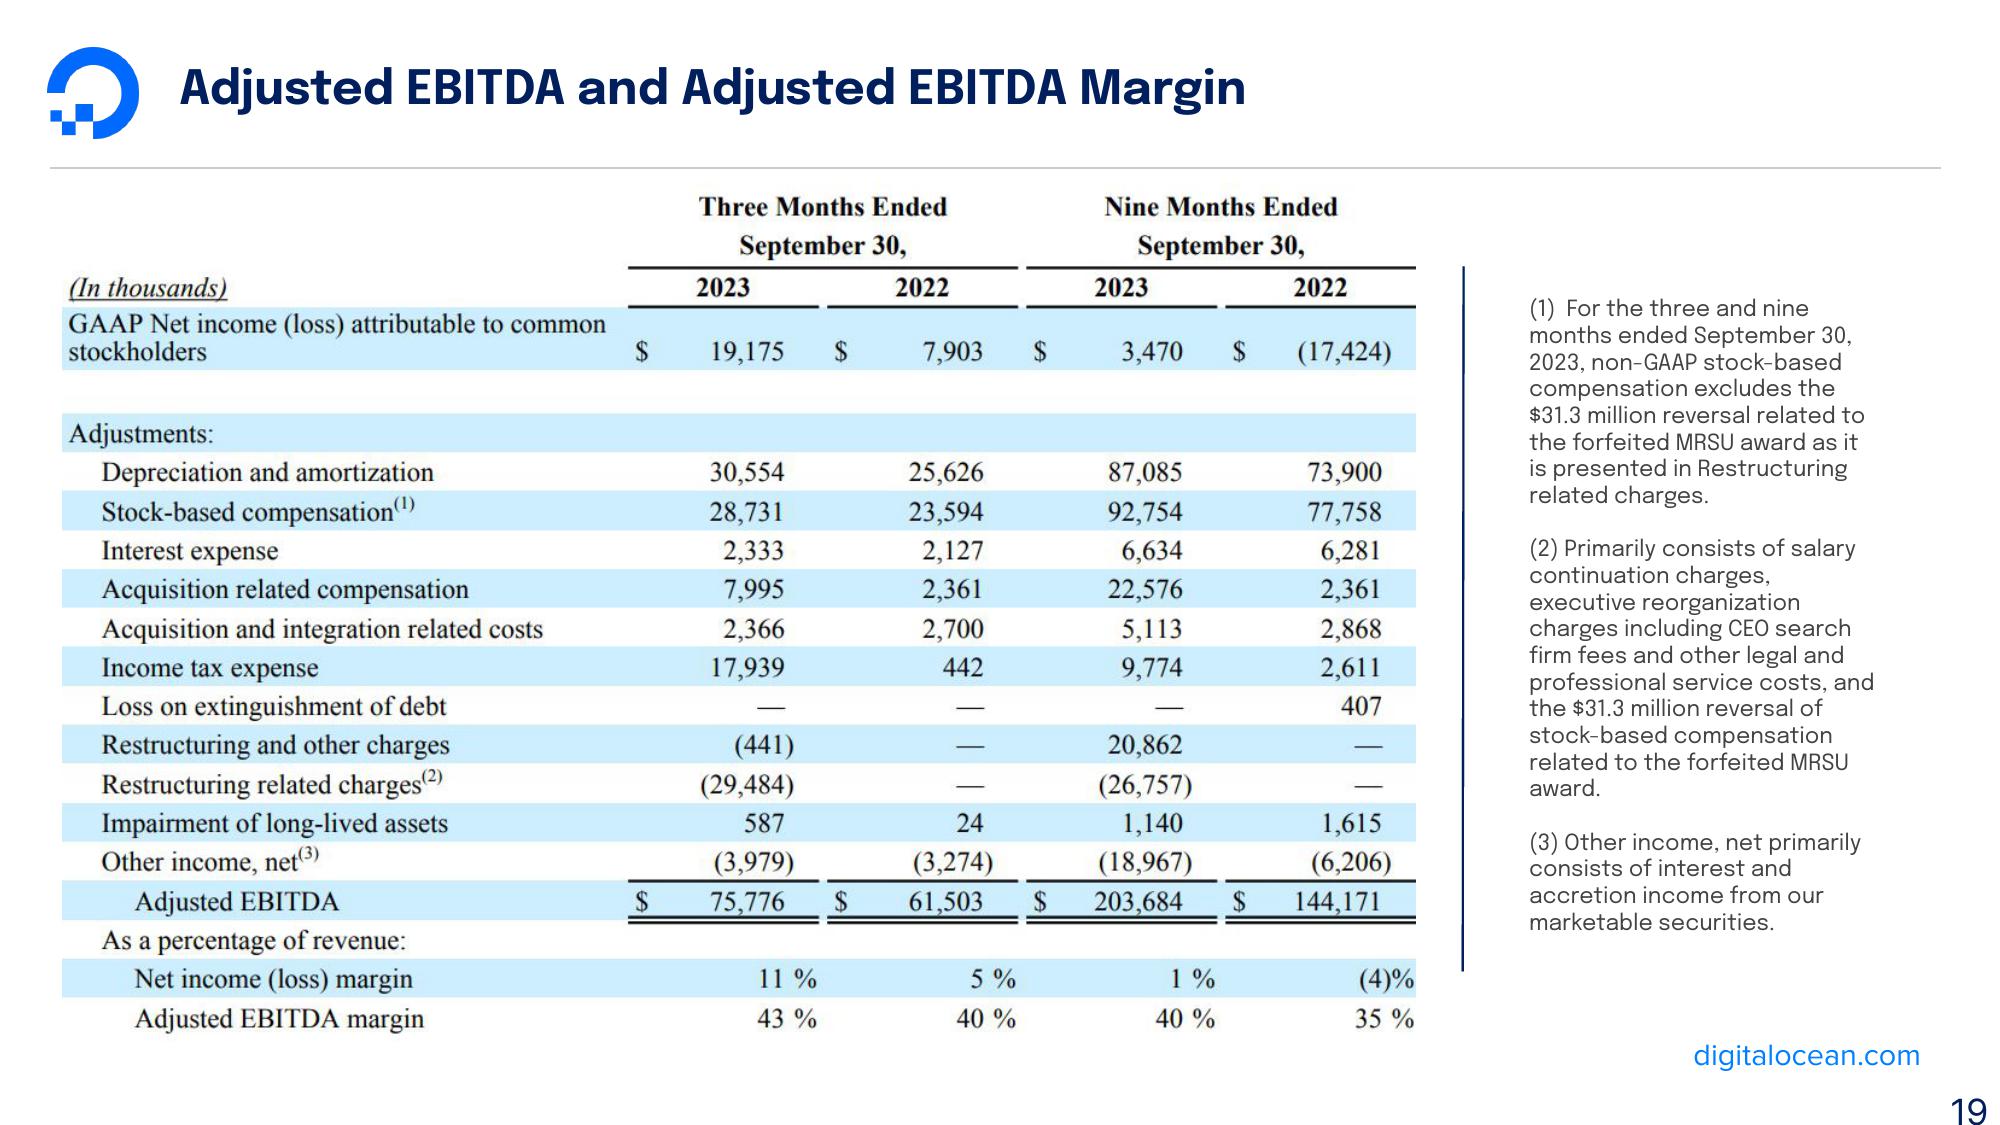
ņ Adjusted EBITDA and Adjusted EBITDA Margin
(In thousands)
GAAP Net income (loss) attributable to common
stockholders
Adjustments:
Depreciation and amortization
Stock-based compensation(¹)
Interest expense
Acquisition related compensation
Acquisition and integration related costs
Income tax expense
Loss on extinguishment of debt
Restructuring and other charges
Restructuring related charges (2)
Impairment of long-lived assets
Other income, net (³)
Adjusted EBITDA
As a percentage of revenue:
Net income (loss) margin
Adjusted EBITDA margin
$
$
Three Months Ended
September 30,
2023
19,175 $
30,554
28,731
2,333
7,995
2,366
17,939
(441)
(29,484)
587
(3,979)
75,776
11 %
43%
$
2022
7,903
25,626
23,594
2,127
2,361
2,700
442
Nine Months Ended
September 30,
5%
40%
2023
3,470
87,085
92,754
6,634
22,576
5,113
9,774
20,862
(26,757)
24
1,140
(18,967)
61,503 $ 203,684 $
(3,274)
$
1%
40 %
2022
(17,424)
73,900
77,758
6,281
2,361
2,868
2,611
407
1,615
(6,206)
144,171
(4)%
35 %
(1) For the three and nine
months ended September 30,
2023, non-GAAP stock-based
compensation excludes the
$31.3 million reversal related to
the forfeited MRSU award as it
is presented in Restructuring
related charges.
(2) Primarily consists of salary
continuation charges,
executive reorganization
charges including CEO search
firm fees and other legal and
professional service costs, and
the $31.3 million reversal of
stock-based compensation
related to the forfeited MRSU
award.
(3) Other income, net primarily
consists of interest and
accretion income from our
marketable securities.
digitalocean.com
19View entire presentation