J.P.Morgan 4Q23 Earnings Results
JPMORGAN CHASE & CO.
CONSUMER & COMMUNITY BANKING
FINANCIAL HIGHLIGHTS, CONTINUED
(in millions, except employee data)
SELECTED BALANCE SHEET DATA (period-end)
Total assets
Loans:
Banking & Wealth Management (a)
Home Lending (b)
Card Services
Auto
Total loans
Deposits
Equity
SELECTED BALANCE SHEET DATA (average)
Total assets
Loans:
Banking & Wealth Management
Home Lending (c)
Card Services
Auto
Total loans
Deposits
Equity
Employees
4Q23
$ 642,951
$
31,142 (d)
259,181 (d)
211,175
77,705
579,203
629,744
30,718 (f)
261,394 (f)
202,685
76,409
571,206
$
3Q23
1,094,738 (e) 1,136,884 (e)
55,500
55,500
141,640
626, 196
30,574 (d)
261,858 (d)
196,955
74,831
564,218
$ 622,760
30,686 (f)
264,041 (f)
195,245
74,358
564,330
1,092,432 (g) 1,143,539 (g)
55,500
55,500
141,125
$
2Q23
QUARTERLY TRENDS
620,193
30,959 (d)
262,432 (d)
191,353
73,587
558,331
1,173,514 (e)
55,500
$ 576,417
30,628 (f)
229,569 (f)
187,028
71,083
518,308
1,157,309 (g)
54,346
137,087
$
$
1Q23
506,382
28,038
172,058
180,079
69,556
449,731
1,147,474
52,000
506,775
28,504
172,124
180,451
68,744
449,823
1,112,967
52,000
135,983
4Q22
$ 514,085
$
29,008
172,554
185,175
68,191
454,928
1,131,611
50,000
504,859
29,412
174,487
177,026
67,623
448,548
1,142,523
50,000
135,347
4Q23 Change
3Q23
3%
2
(1)
7
4
3
(4)
1
1 +3+
(1)
(4)
JPMORGAN CHASE & Co.
4Q22
25%
7
50
14
14
27
(3)
11
25
4
50
14
13
27
(4)
11
5
2023
$ 642,951
$
31,142 (d)
259,181 (d)
211,175
77,705
579,203
1,094,738 (e)
55,500
584,367
30,142 (f)
232,115 (f)
191,424
72,674
526,355
1,126,552 (g)
54,349
141,640
FULL YEAR
$
2022
514,085
29,008
172,554
185,175
68,191
454,928
1,131,611
50,000
$ 497,263
31,545
176,285
163,335
68,098
439,263
1,162,680
50,000
135,347
2023 Change
2022
25%
7
50
14
14
27
(3)
11
18
(4)
32
17
7
20
(3)
9
5
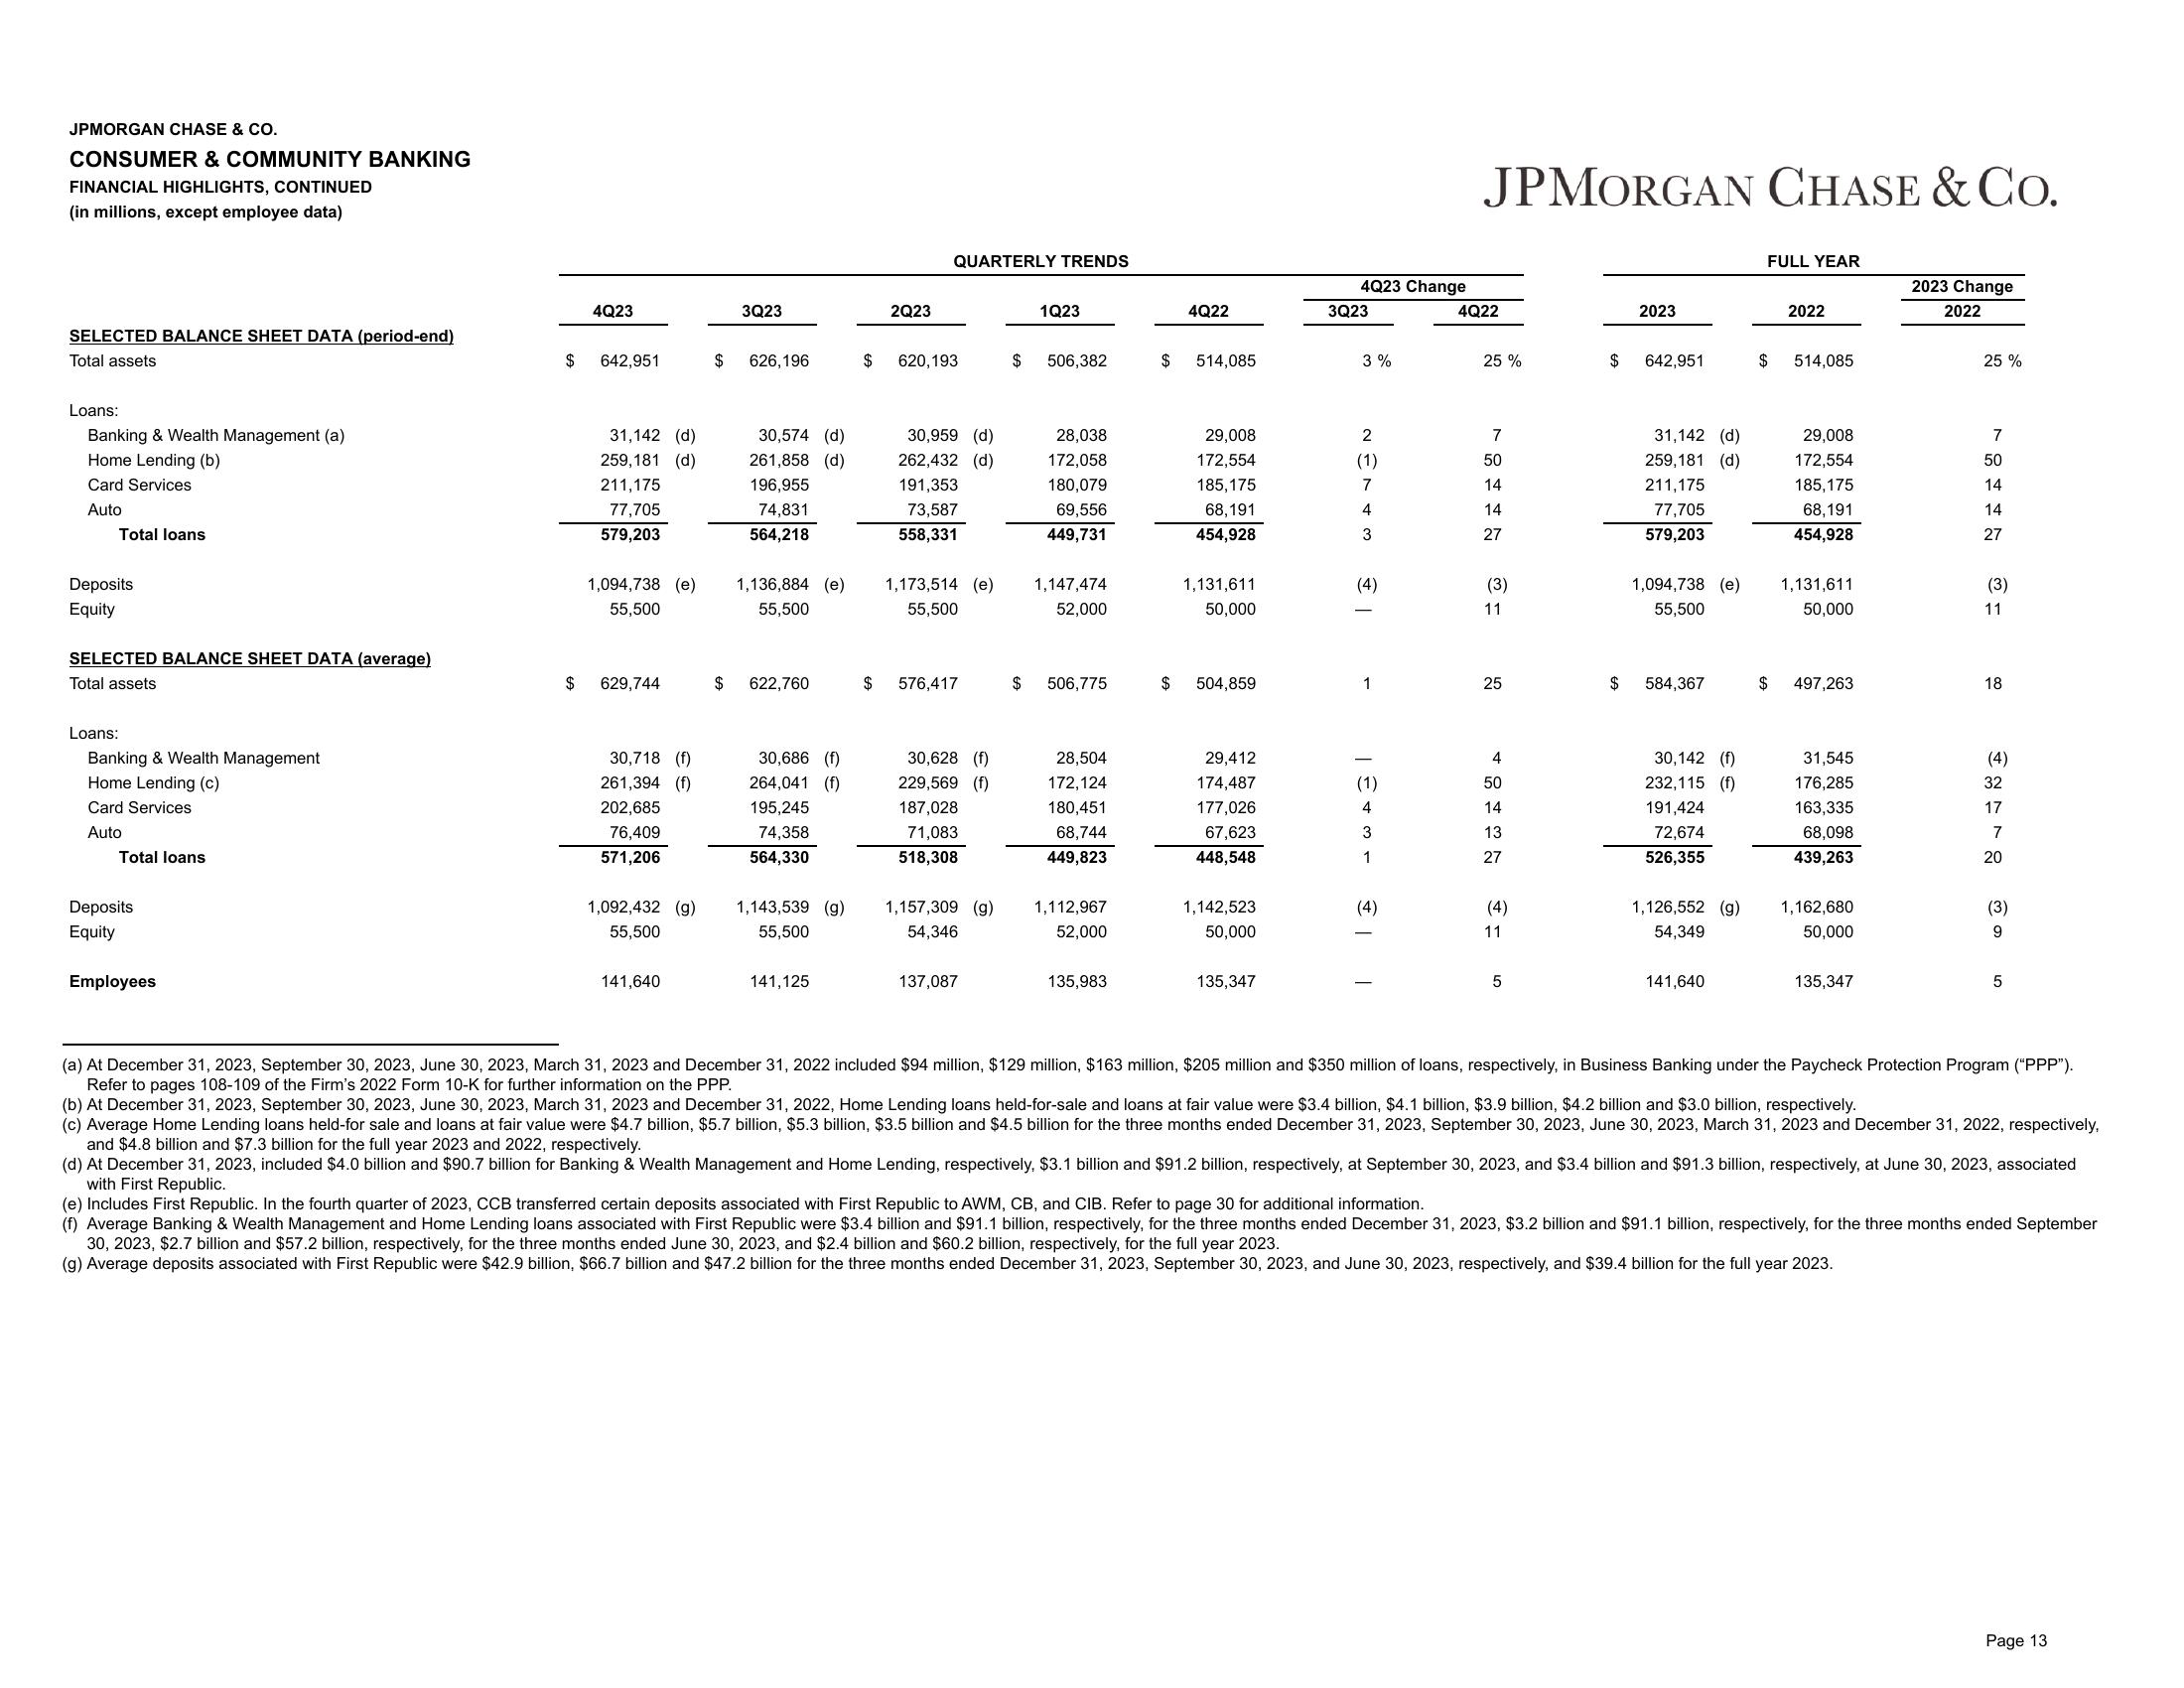
(a) At December 31, 2023, September 30, 2023, June 30, 2023, March 31, 2023 and December 31, 2022 included $94 million, $129 million, $163 million, $205 million and $350 million of loans, respectively, in Business Banking under the Paycheck Protection Program ("PPP").
Refer to pages 108-109 of the Firm's 2022 Form 10-K for further information on the PPP.
(b) At December 31, 2023, September 30, 2023, June 30, 2023, March 31, 2023 and December 31, 2022, Home Lending loans held-for-sale and loans at fair value were $3.4 billion, $4.1 billion, $3.9 billion, $4.2 billion and $3.0 billion, respectively.
(c) Average Home Lending loans held-for sale and loans at fair value were $4.7 billion, $5.7 billion, $5.3 billion, $3.5 billion and $4.5 billion for the three months ended December 31, 2023, September 30, 2023, June 30, 2023, March 31, 2023 and December 31, 2022, respectively,
and $4.8 billion and $7.3 billion for the full year 2023 and 2022, respectively.
(d) At December 31, 2023, included $4.0 billion and $90.7 billion for Banking & Wealth Management and Home Lending, respectively, $3.1 billion and $91.2 billion, respectively, at September 30, 2023, and $3.4 billion and $91.3 billion, respectively, at June 30, 2023, associated
with First Republic.
(e) Includes First Republic. In the fourth quarter of 2023, CCB transferred certain deposits associated with First Republic to AWM, CB, and CIB. Refer to page 30 for additional information.
(f) Average Banking & Wealth Management and Home Lending loans associated with First Republic were $3.4 billion and $91.1 billion, respectively, for the three months ended December 31, 2023, $3.2 billion and $91.1 billion, respectively, for the three months ended September
30, 2023, $2.7 billion and $57.2 billion, respectively, for the three months ended June 30, 2023, and $2.4 billion and $60.2 billion, respectively, for the full year 2023.
(g) Average deposits associated with First Republic were $42.9 billion, $66.7 billion and $47.2 billion for the three months ended December 31, 2023, September 30, 2023, and June 30, 2023, respectively, and $39.4 billion for the full year 2023.
Page 13View entire presentation