Zoominfo Results Presentation Deck
Q1 EARNINGS CALL > FINANCIAL RESULTS
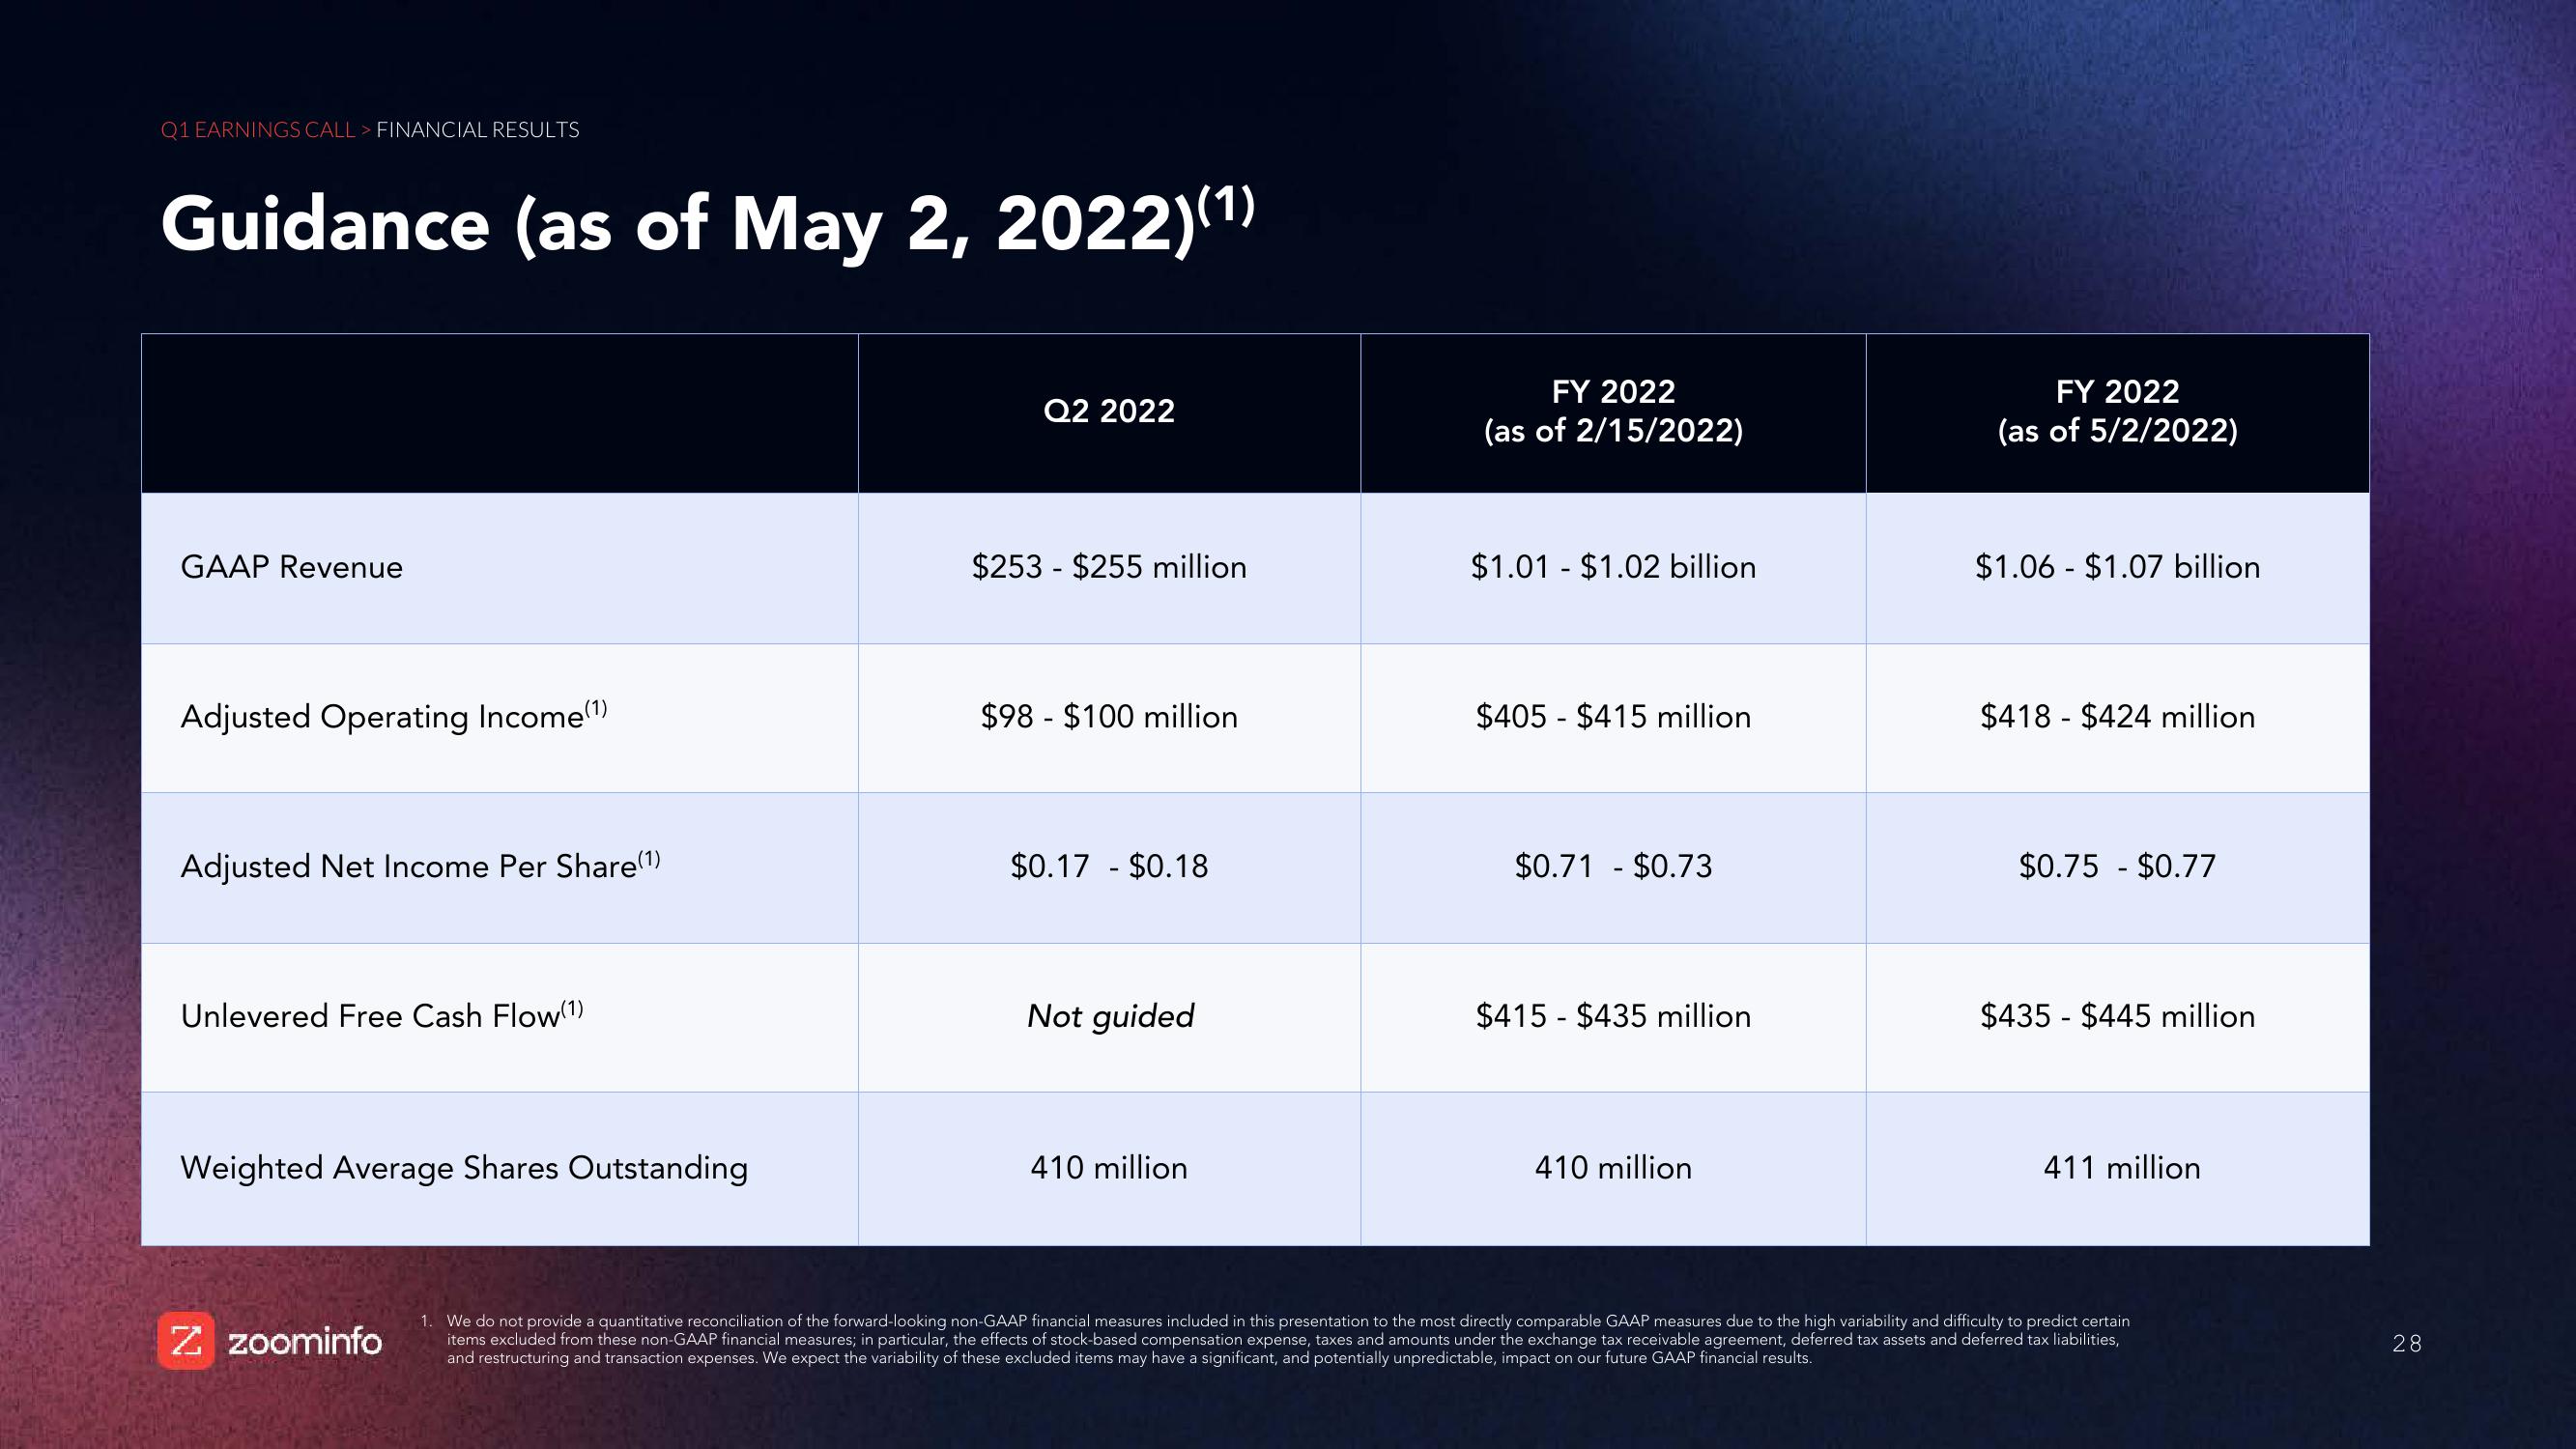
Guidance (as of May 2, 2022)(¹)
GAAP Revenue
Adjusted Operating Income(1)
Adjusted Net Income Per Share(¹)
Unlevered Free Cash Flow(1)
Weighted Average Shares Outstanding
Z zoominfo
Q2 2022
$253 $255 million
$98 $100 million
$0.17 - $0.18
Not guided
410 million
FY 2022
(as of 2/15/2022)
$1.01 $1.02 billion
$405 $415 million
$0.71 - $0.73
$415 $435 million
410 million
FY 2022
(as of 5/2/2022)
$1.06 $1.07 billion
$418 - $424 million
$0.75 - $0.77
$435 $445 million
411 million
1. We do not provide a quantitative reconciliation of the forward-looking non-GAAP financial measures included in this presentation to the most directly comparable GAAP measures due to the high variability and difficulty to predict certain
items excluded from these non-GAAP financial measures; in particular, the effects of stock-based compensation expense, taxes and amounts under the exchange tax receivable agreement, deferred tax assets and deferred tax liabilities,
and restructuring and transaction expenses. We expect the variability of these excluded items may have a significant, and potentially unpredictable, impact on our future GAAP financial results.
28View entire presentation