Shift SPAC Presentation Deck
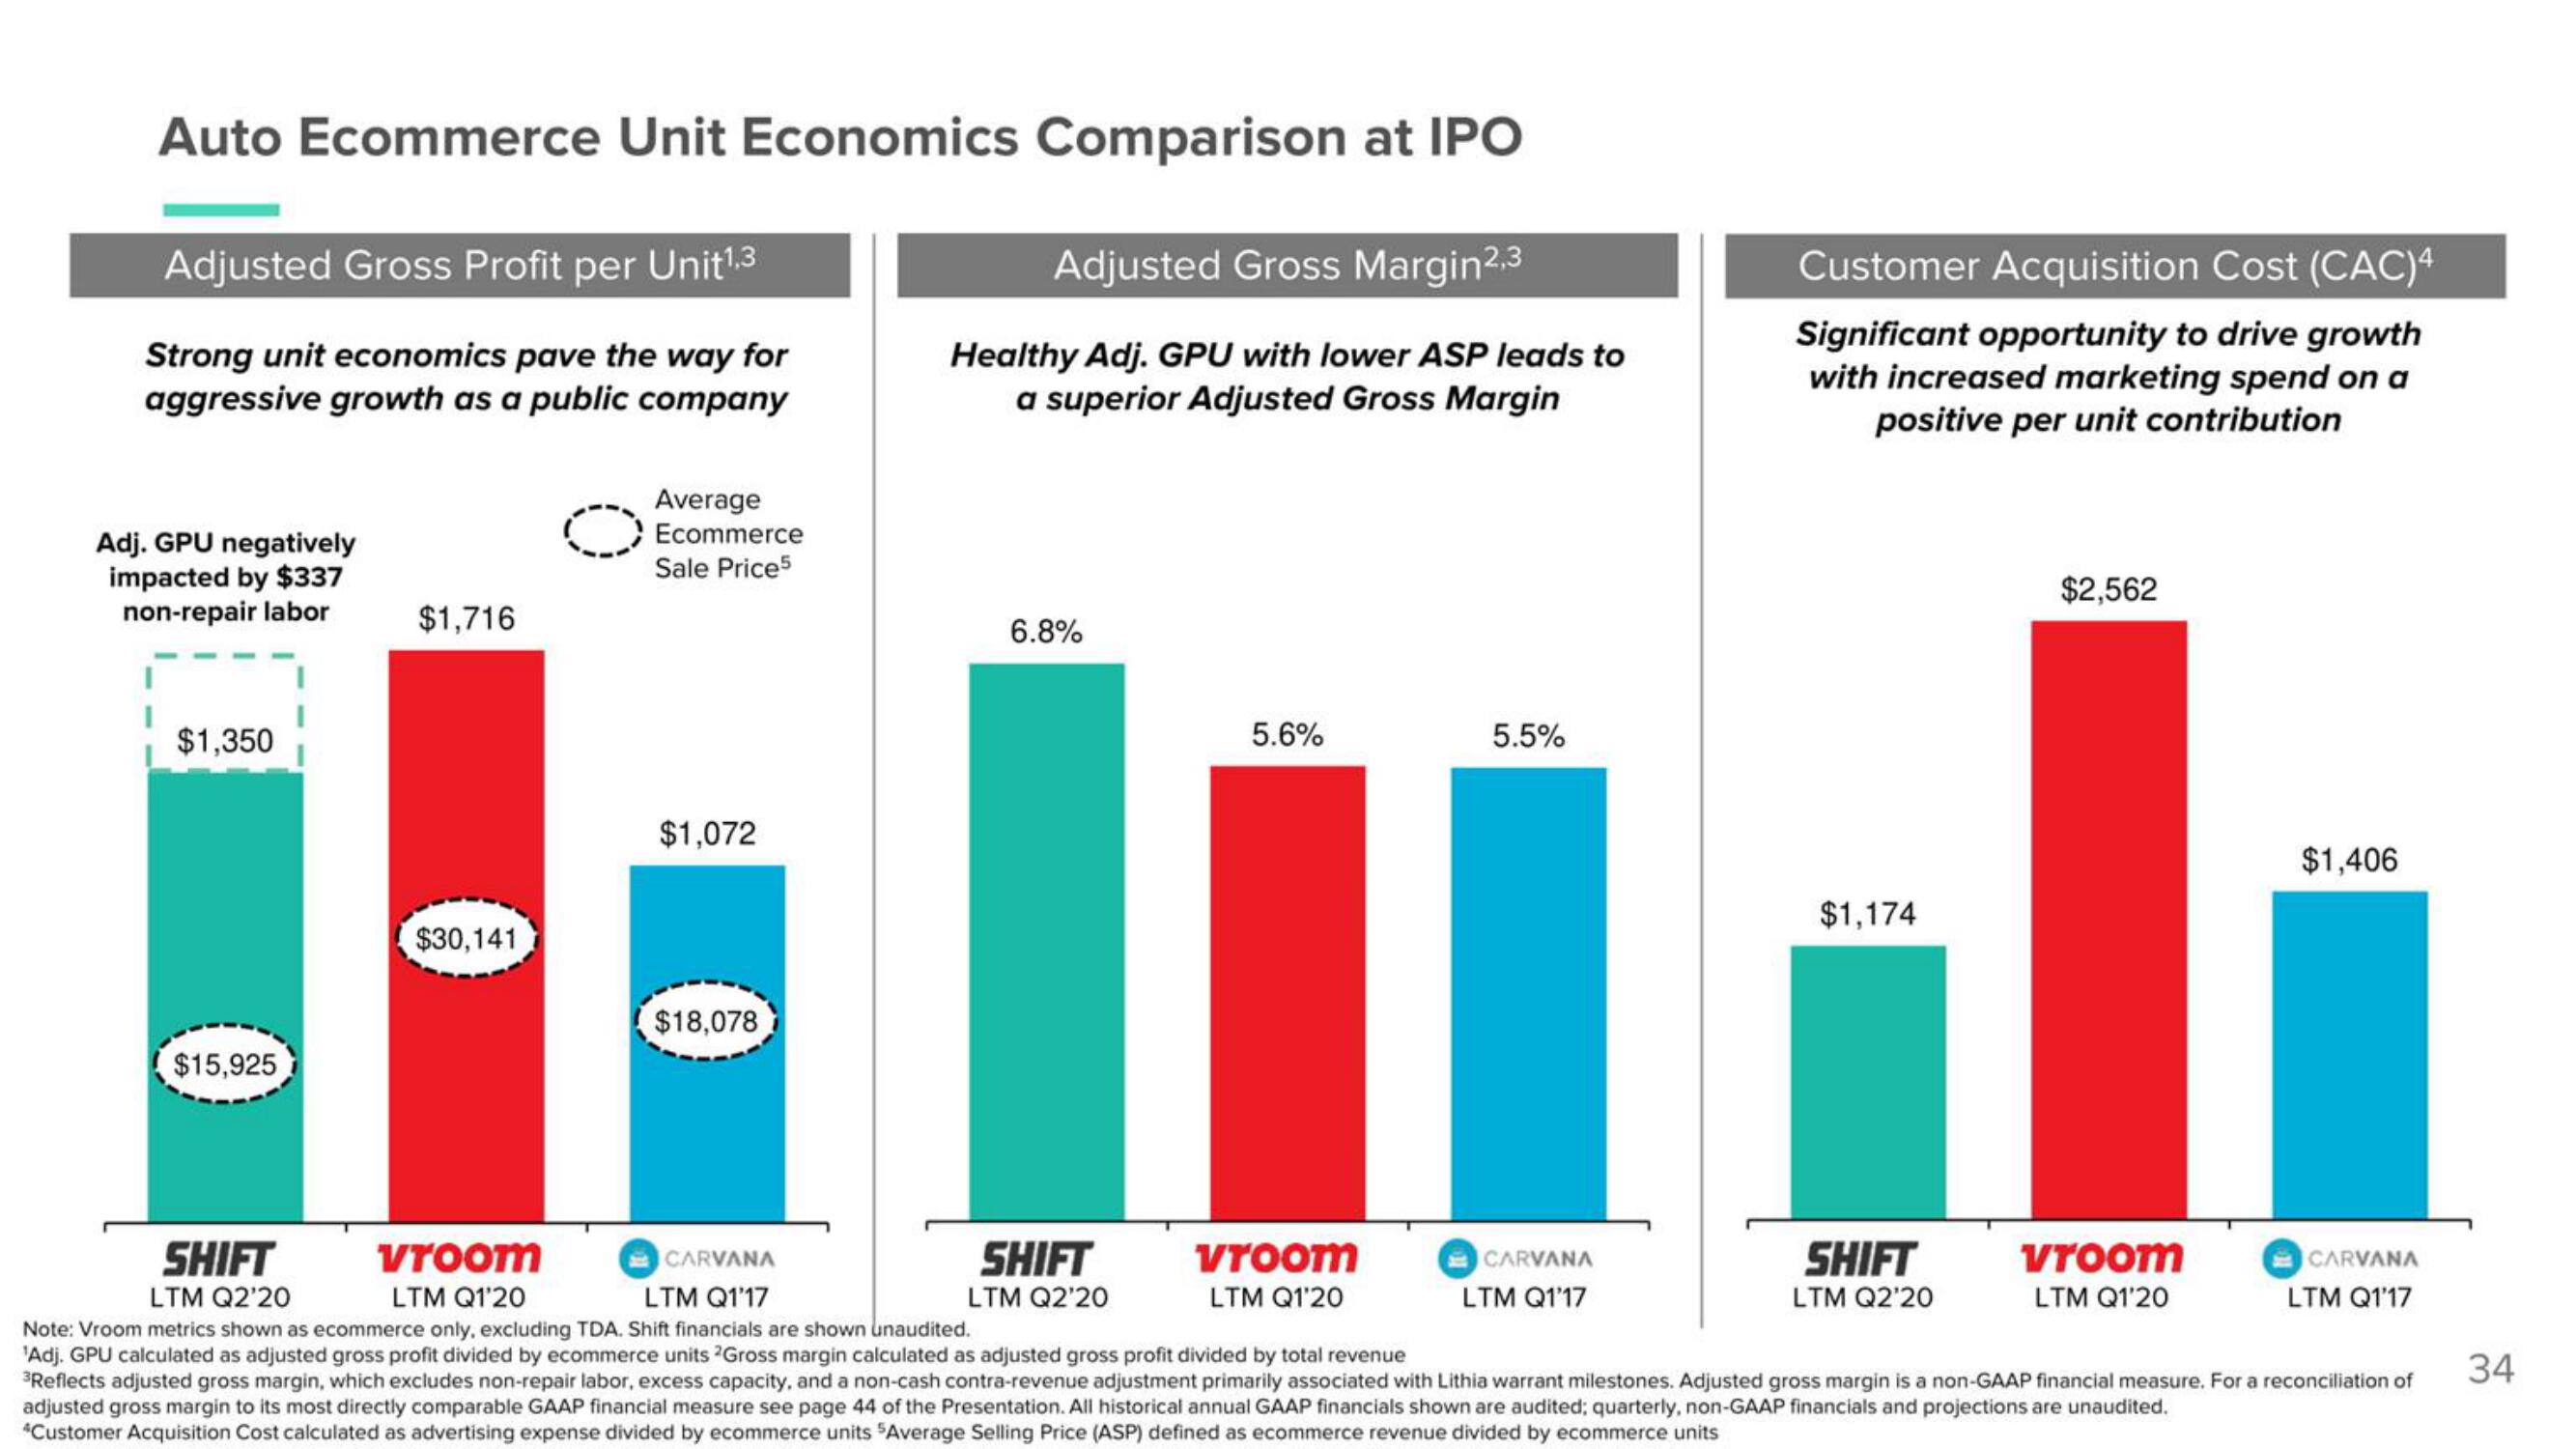
Auto Ecommerce Unit Economics Comparison at IPO
Adjusted Gross Profit per Unit¹,3
Strong unit economics pave the way for
aggressive growth as a public company
Adj. GPU negatively
impacted by $337
non-repair labor
$1,350
$15,925
$1,716
$30,141
Average
Ecommerce
Sale Price5
$1,072
$18,078
Adjusted Gross Margin2,3
Healthy Adj. GPU with lower ASP leads to
a superior Adjusted Gross Margin
6.8%
SHIFT
LTM Q2'20
5.6%
Vroom
LTM Q1'20
5.5%
Customer Acquisition Cost (CAC)4
Significant opportunity to drive growth
with increased marketing spend on a
positive per unit contribution
CARVANA
LTM Q1'17
$1,174
SHIFT
LTM Q2'20
$2,562
SHIFT
Vroom
CARVANA
LTM Q1'20
LTM Q1'17
LTM Q2'20
Note: Vroom metrics shown as ecommerce only, excluding TDA. Shift financials are shown unaudited.
'Adj. GPU calculated as adjusted gross profit divided by ecommerce units 2Gross margin calculated as adjusted gross profit divided by total revenue
³Reflects adjusted gross margin, which excludes non-repair labor, excess capacity, and a non-cash contra-revenue adjustment primarily associated with Lithia warrant milestones. Adjusted gross margin is a non-GAAP financial measure. For a reconciliation of
adjusted gross margin to its most directly comparable GAAP financial measure see page 44 of the Presentation. All historical annual GAAP financials shown are audited; quarterly, non-GAAP financials and projections are unaudited.
*Customer Acquisition Cost calculated as advertising expense divided by ecommerce units "Average Selling Price (ASP) defined as ecommerce revenue divided by ecommerce units
$1,406
vroom
LTM Q1'20
CARVANA
LTM Q1'17
34View entire presentation