AngloAmerican Results Presentation Deck
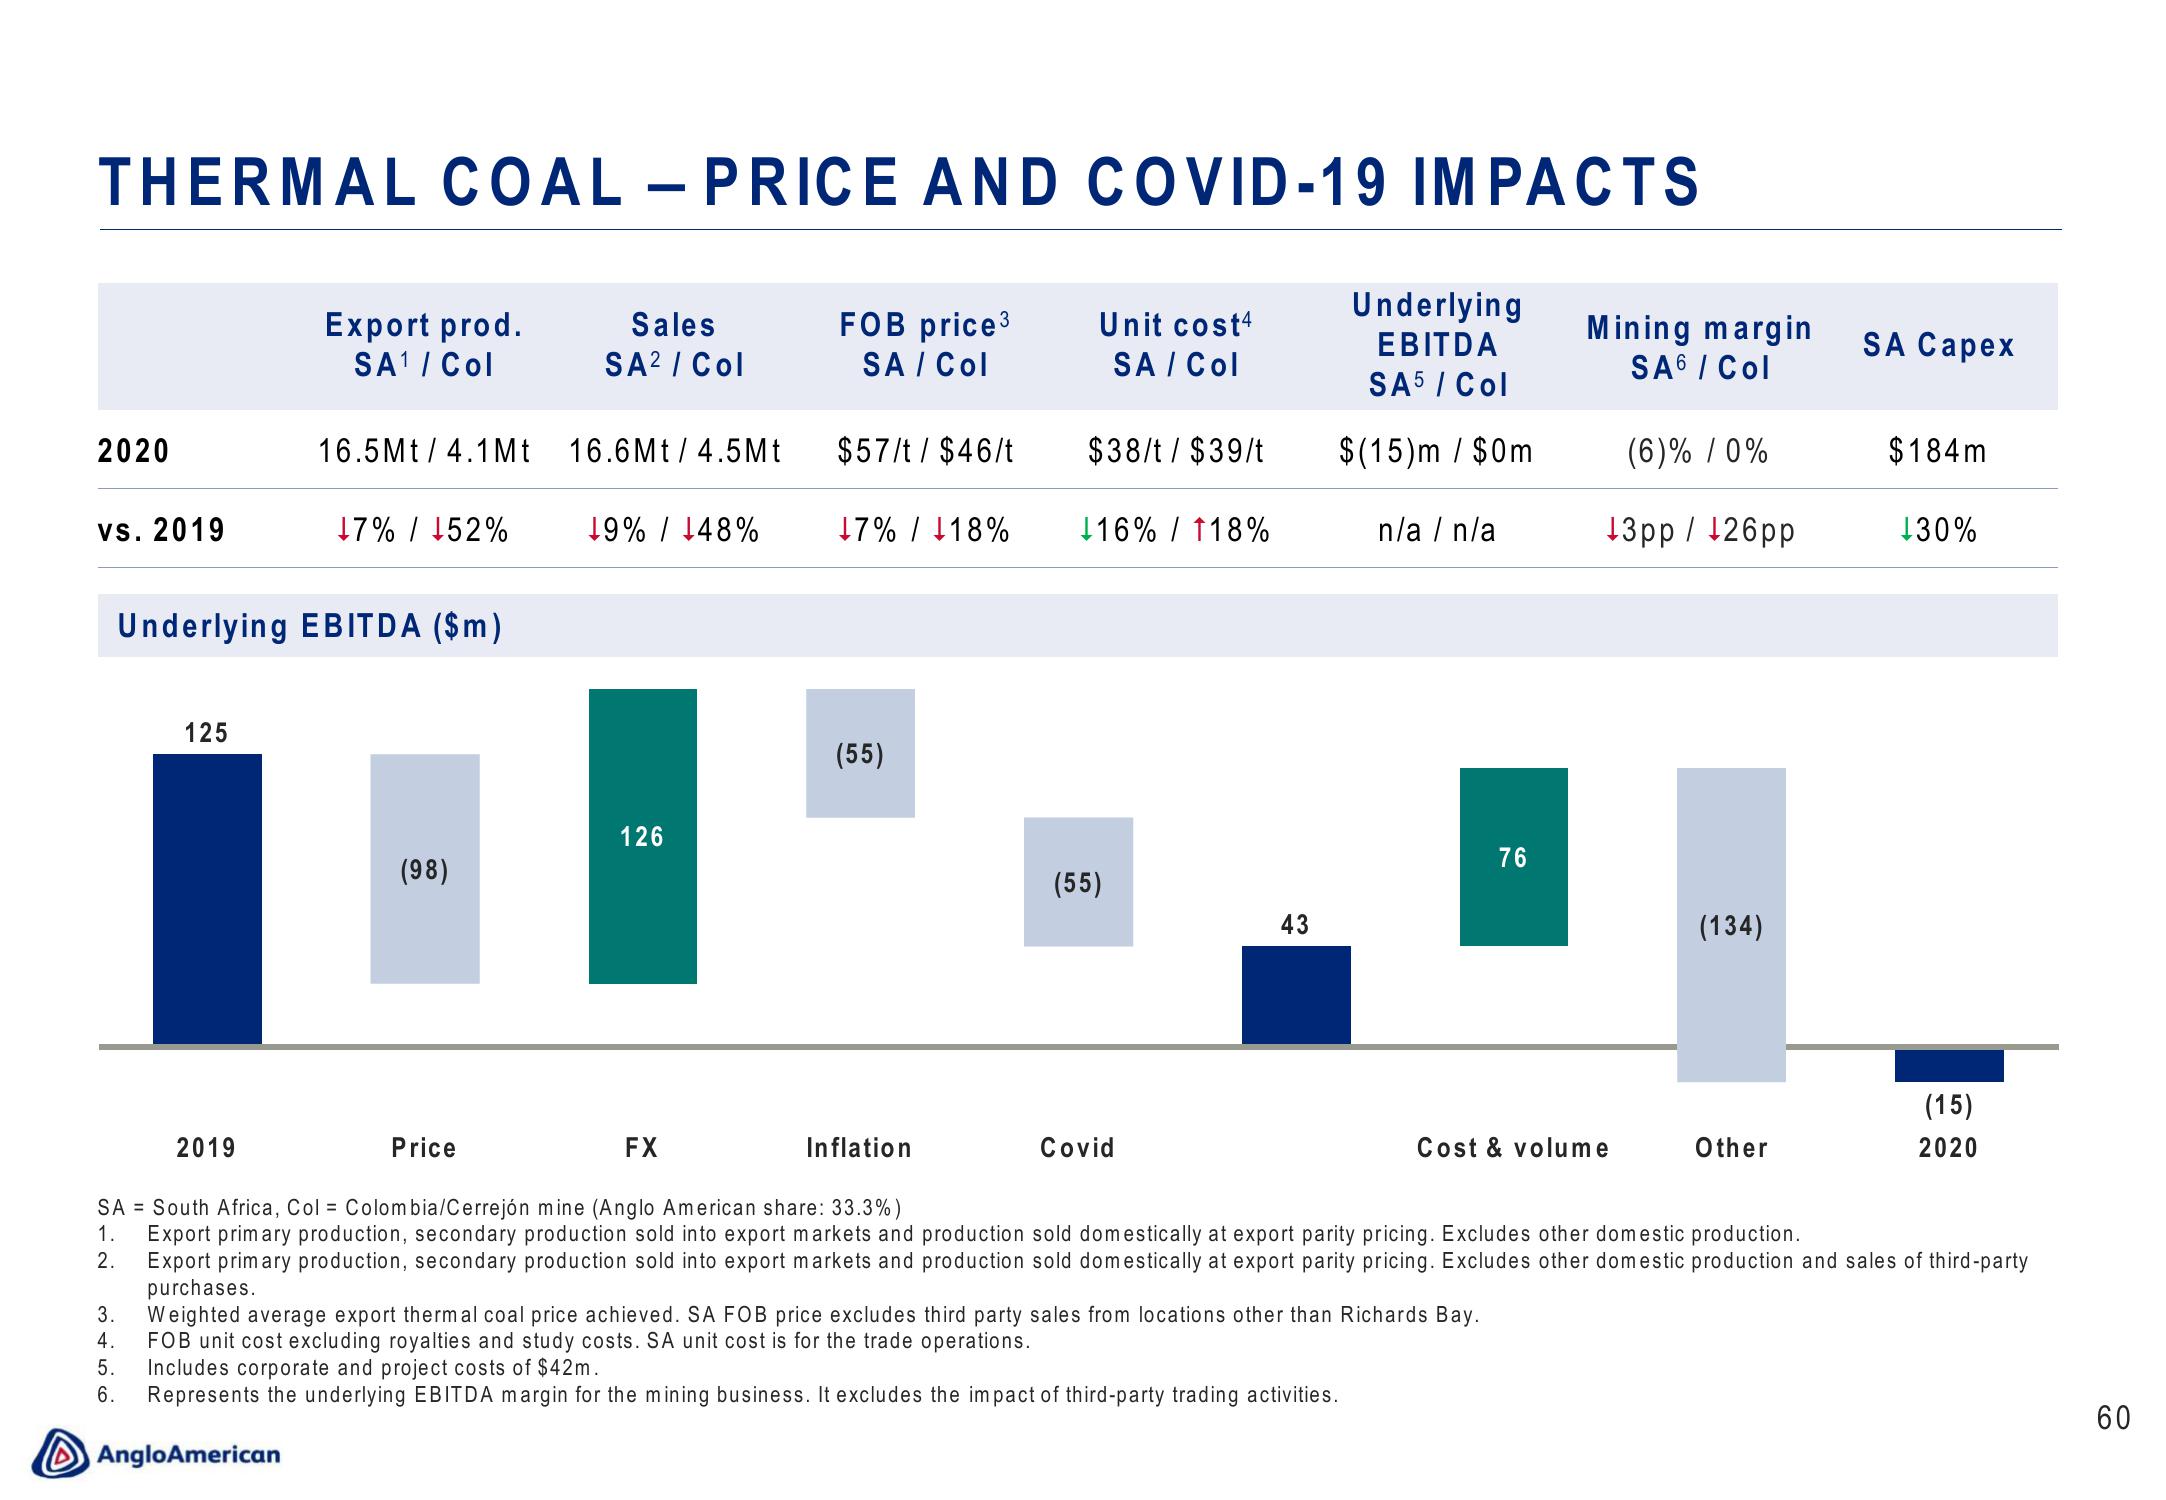
THERMAL COAL - PRICE AND COVID-19 IMPACTS
2020
vs. 2019
125
Export prod.
SA¹ / Col
Underlying EBITDA ($m)
2019
Anglo American
16.5Mt/4.1 Mt 16.6Mt/4.5Mt
17% / 152%
(98)
Sales
SA² / Col
Price
19% / 148%
126
FOB price ³
SA / Col
FX
$57/t/ $46/t
17% / 18%
(55)
Unit cost4
SA / Col
$38/t/ $39/t
16% / 118%
(55)
43
Covid
Underlying
EBITDA
SA5 / Col
$(15)m / $0m
n/a / n/a
76
Mining margin
SA6 / Col
(6)% / 0%
13pp / 126pp
Inflation
SA = South Africa, Col = Colombia/Cerrejón mine (Anglo American share: 33.3%)
1. Export primary production, secondary production sold into export markets and production sold domestically at export parity pricing. Excludes other domestic production.
Export primary production, secondary production sold into export markets and production sold domestically at export parity pricing. Excludes other domestic production and sales of third-party
purchases.
2.
3. Weighted average export thermal coal price achieved. SA FOB price excludes third party sales from locations other than Richards Bay.
4.
FOB unit cost excluding royalties and study costs. SA unit cost is for the trade operations.
5. Includes corporate and project costs of $42m.
6. Represents the underlying EBITDA margin for the mining business. It excludes the impact of third-party trading activities.
(134)
Cost & volume
SA Capex
Other
$184m
130%
(15)
2020
60View entire presentation