Ashtead Group Results Presentation Deck
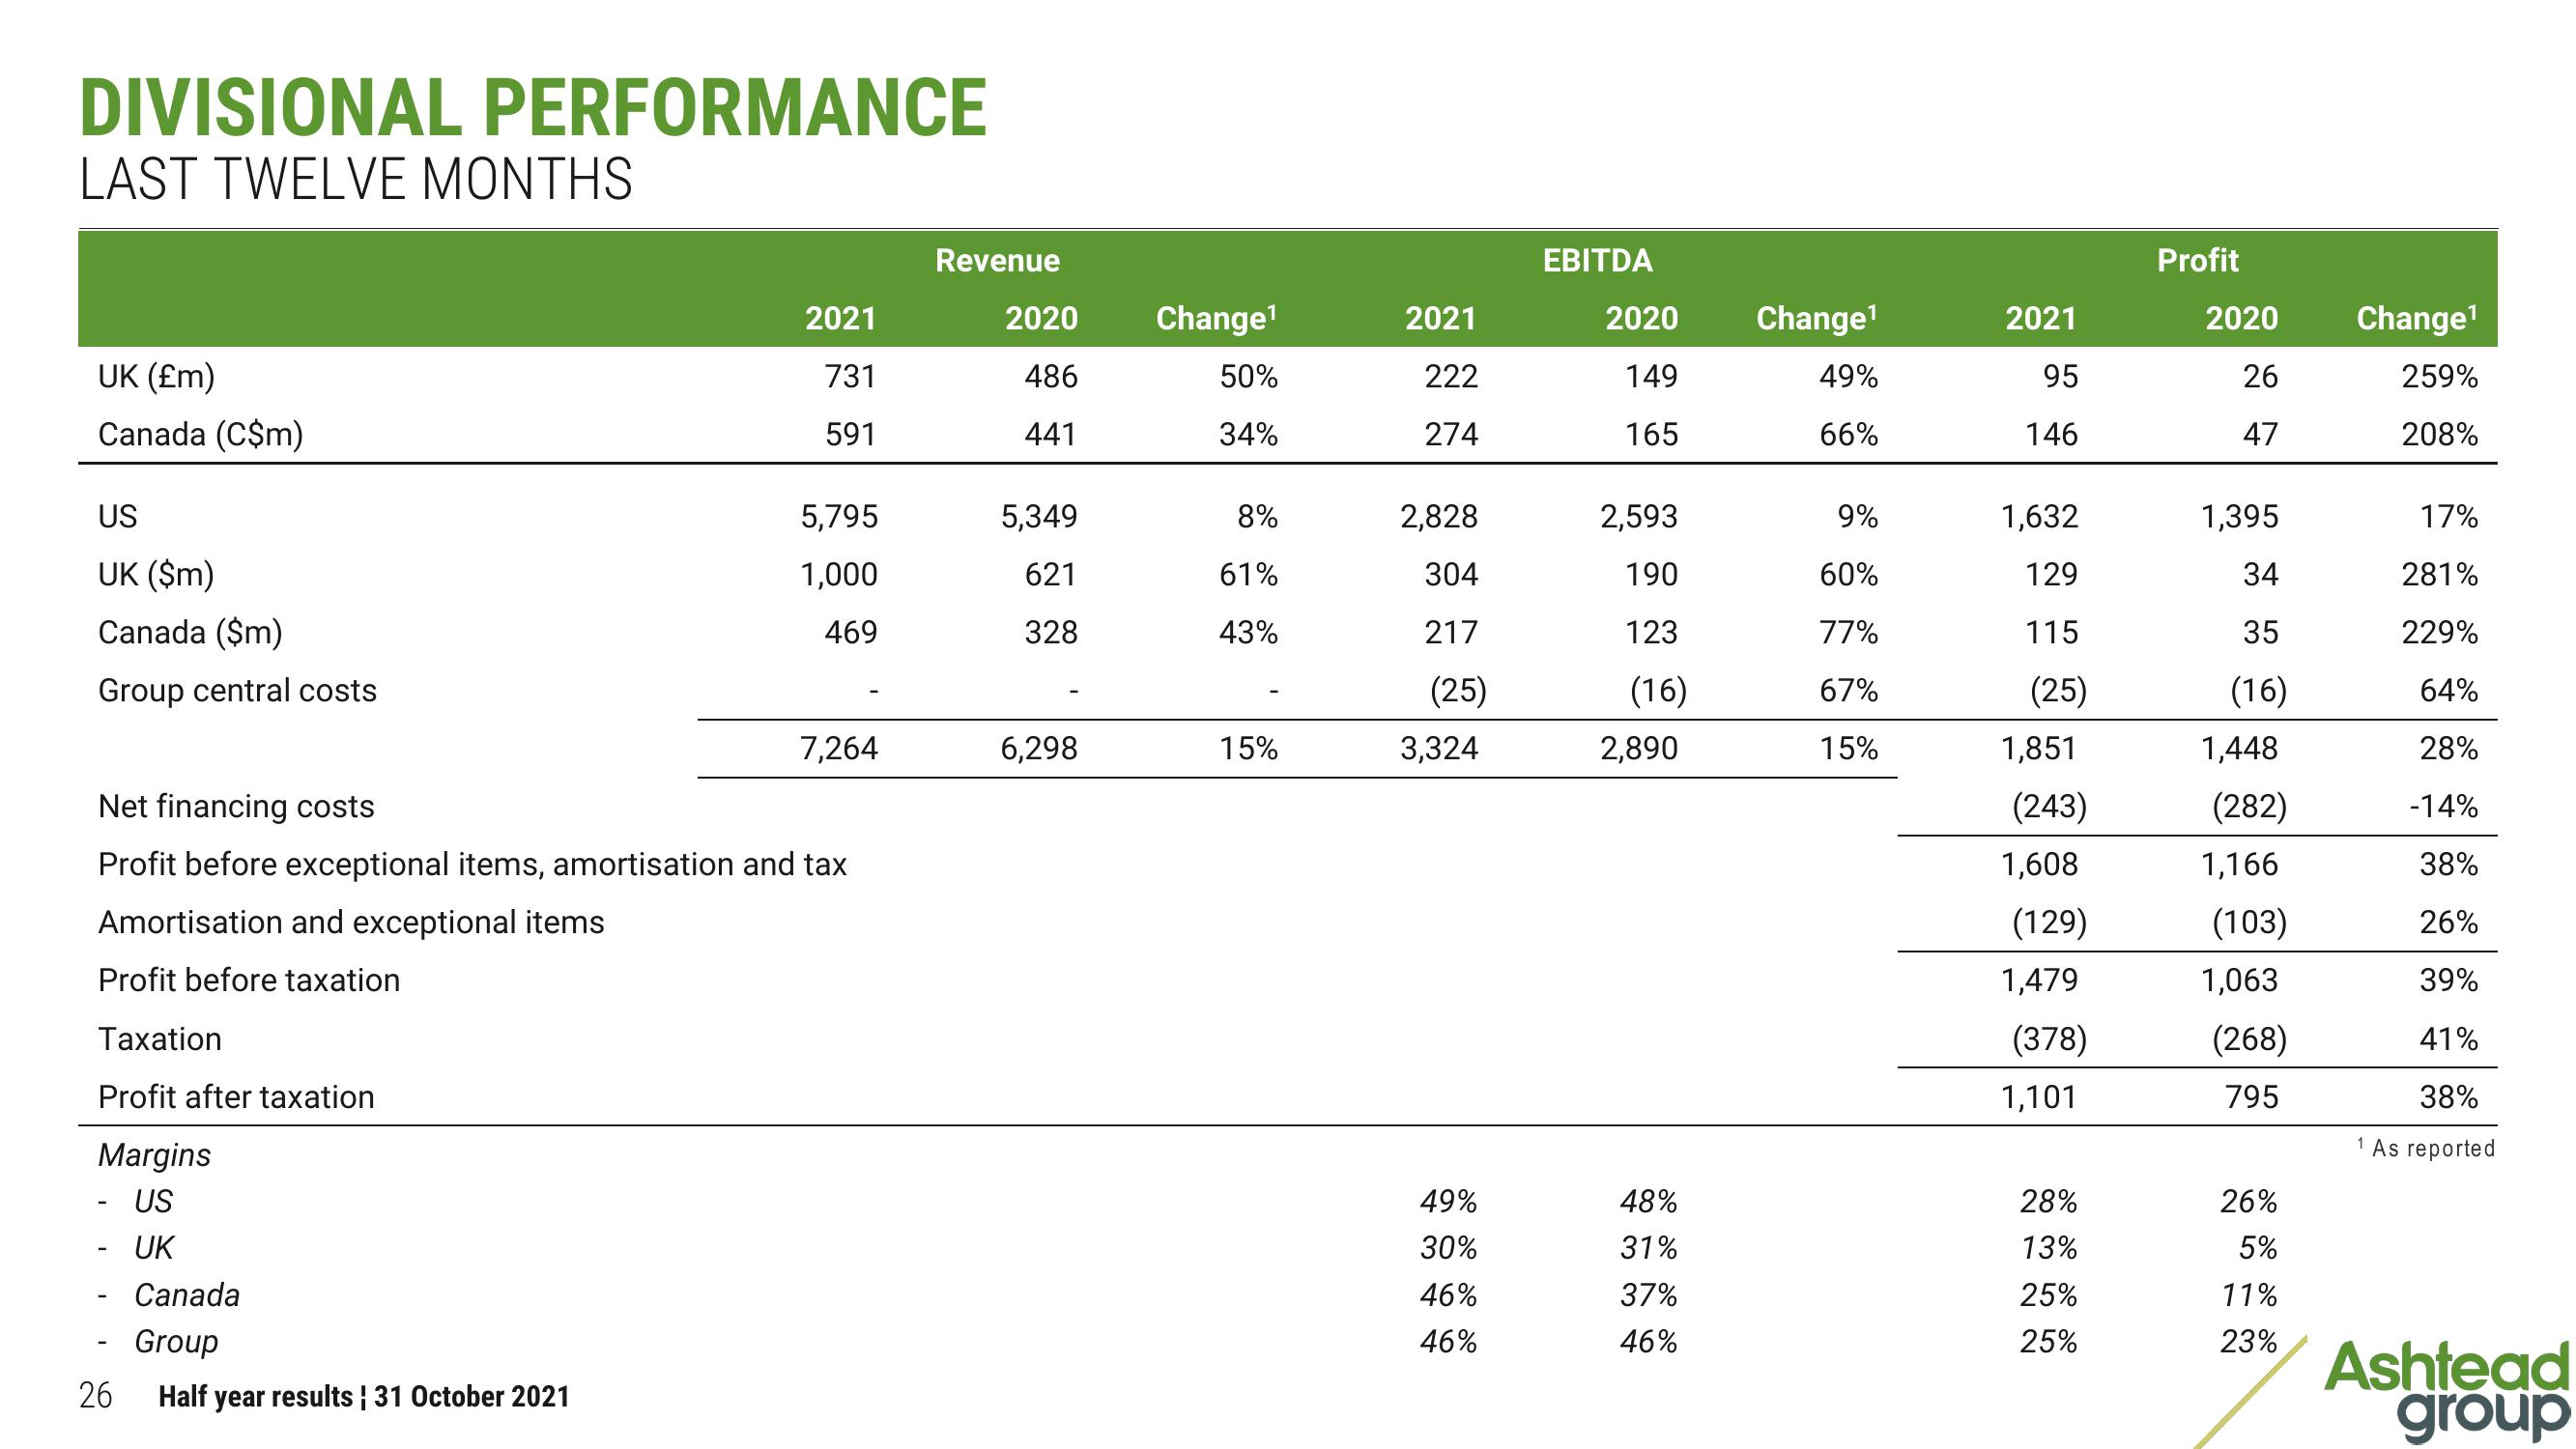
DIVISIONAL PERFORMANCE
LAST TWELVE MONTHS
UK (£m)
Canada (C$m)
US
UK ($m)
Canada ($m)
Group central costs
Amortisation and exceptional items
Profit before taxation
Taxation
Profit after taxation
Margins
- US
UK
26
2021
731
591
Net financing costs
Profit before exceptional items, amortisation and tax
Canada
Group
Half year results | 31 October 2021
5,795
1,000
469
7,264
Revenue
2020
486
441
5,349
621
328
6,298
Change¹
50%
34%
8%
61%
43%
15%
2021
222
274
2,828
304
217
(25)
3,324
49%
30%
46%
46%
EBITDA
2020
149
165
2,593
190
123
(16)
2,890
48%
31%
37%
46%
Change¹
49%
66%
9%
60%
77%
67%
15%
2021
95
146
1,632
129
115
(25)
1,851
(243)
1,608
(129)
1,479
(378)
1,101
28%
13%
25%
25%
Profit
2020
26
47
1,395
34
35
(16)
1,448
(282)
1,166
(103)
1,063
(268)
795
26%
5%
11%
23%
Change¹
259%
208%
1
17%
281%
229%
64%
28%
-14%
38%
26%
39%
41%
38%
As reported
Ashtead
groupView entire presentation