Telia Company Results Presentation Deck
LED markets
Lithuania
Reported currency, in SEK millions, like for like growth
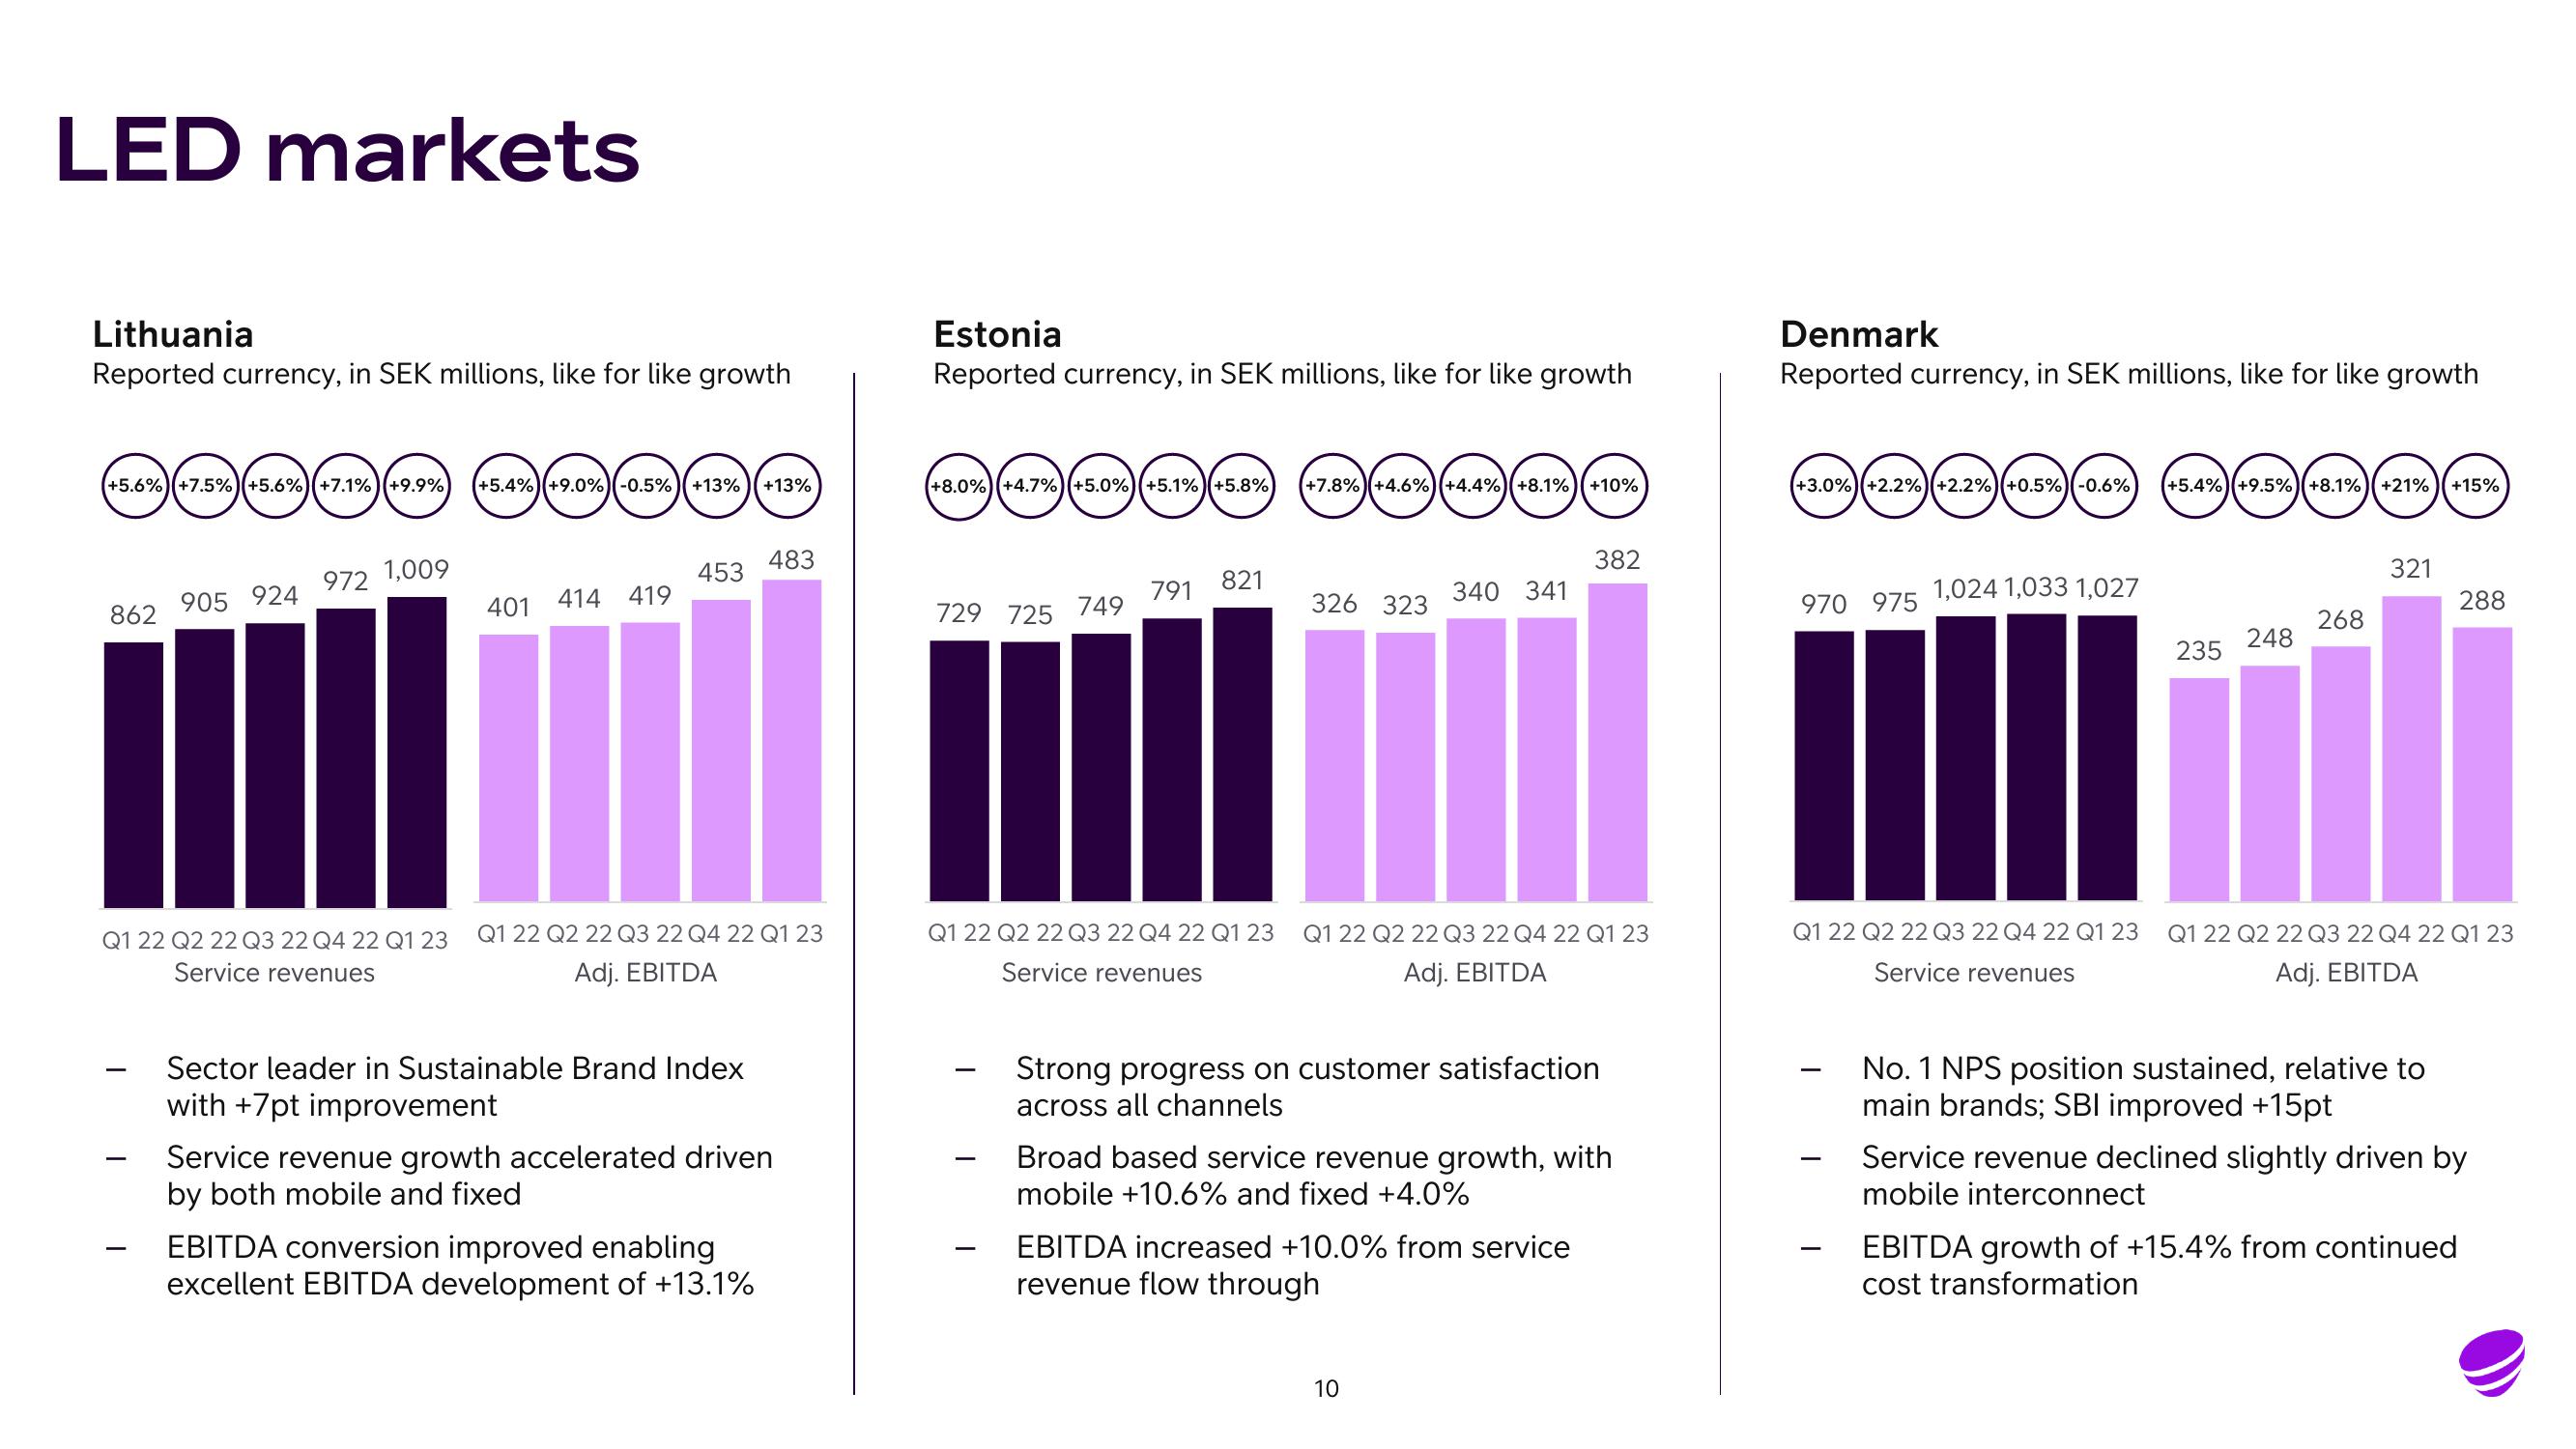
(+5.6%) (+7.5% (+5.6%) +7.1%) (+9.9% +5.4%) (+9.0%)(-0.5%) (+13%)(+13%
862
905 924
972
1,009
Q1 22 Q2 22 Q3 22 Q4 22 Q1 23
Service revenues
401
414
419
453
Q1 22 Q2 22 Q3 22 Q4 22 Q1 23
Adj. EBITDA
Sector leader in Sustainable Brand Index
with +7pt improvement
483
Service revenue growth accelerated driven
by both mobile and fixed
EBITDA conversion improved enabling
excellent EBITDA development of +13.1%
Estonia
Reported currency, in SEK millions, like for like growth
+8.0%+4.7%) (+5.0%) (+5.1%)+5.8%
729 725
749
-
791
821
Q1 22 Q2 22 Q3 22 Q4 22 Q1 23
Service revenues
+7.8%+4.6%) (+4.4%) (+8.1%) +10%
326 323
340 341
Q1 22 Q2 22 Q3 22 Q4 22 Q1 23
Adj. EBITDA
382
Strong progress on customer satisfaction
across all channels
Broad based service revenue growth, with
mobile +10.6% and fixed +4.0%
EBITDA increased +10.0% from service
revenue flow through
10
Denmark
Reported currency, in SEK millions, like for like growth
வளைஞஊருருருரு
+5.4%) (+9.5%) (+8.1%) (+21%)(+15%
+3.0%)(+2.2%) (+2.2%) (+0.5%)(-0.6%
970 975
1,024 1,033 1,027
235
248
268
321
Q1 22 Q2 22 Q3 22 Q4 22 Q1 23 Q1 22 Q2 22 Q3 22 Q4 22 Q1 23
Service revenues
Adj. EBITDA
No. 1 NPS position sustained, relative to
main brands; SBI improved +15pt
288
Service revenue declined slightly driven by
mobile interconnect
EBITDA growth of +15.4% from continued
cost transformationView entire presentation