Overstock Results Presentation Deck
Contribution Reconciliation
overstock.
Q3 2018
Total net revenue
Cost of goods sold
Gross profit
Less: Sales and marketing expense
Contribution
Contribution margin
Q3 2017
Total net revenue
Cost of goods sold
Gross profit
Less: Sales and marketing expense
Plus: Club O Rewards and gift card breakage*
(included in Other expense, net)
Contribution
Contribution margin
Q2 2018
Total net revenue
Cost of goods sold
Gross profit
Less: Sales and marketing expense
Contribution
Contribution margin
$
$
$
$
$
Direct
Partner Retail Total
15,424 $420,351 $ 435,775 $
16,205
350,651
(781) $
85,124 $
55,182
29,942 $
6.9%
334,446
85,905 $
19,645 $ 400,419 $ 420,064 $
19,577 318,121 337,698
82,298 $ 82,366 $
44,910
68 $
692
38,148 $
9.1%
14,715 $ 462,968 $ 477,683 $
14,672 372,580 387,252
43 $ 90,388 $ 90,431 $
93,747
(3,316) $
-0.7%
$
Other
4,805 $ 440,580
353,864
86,716
3,213
1,592 $
130
1,462 $
30.4%
55,312
31,404
7.1%
340,332
3,943 $ 424,007
2,634
1,309 $
243
83,675
45,153
1,066
27.0%
Total
$
$
692
39,214
9.2%
391,390
5,450 $ 483,133
4,138
1,312 $
669
643
11.8%
91,743
94,416
(2,673)
-0.6%
35
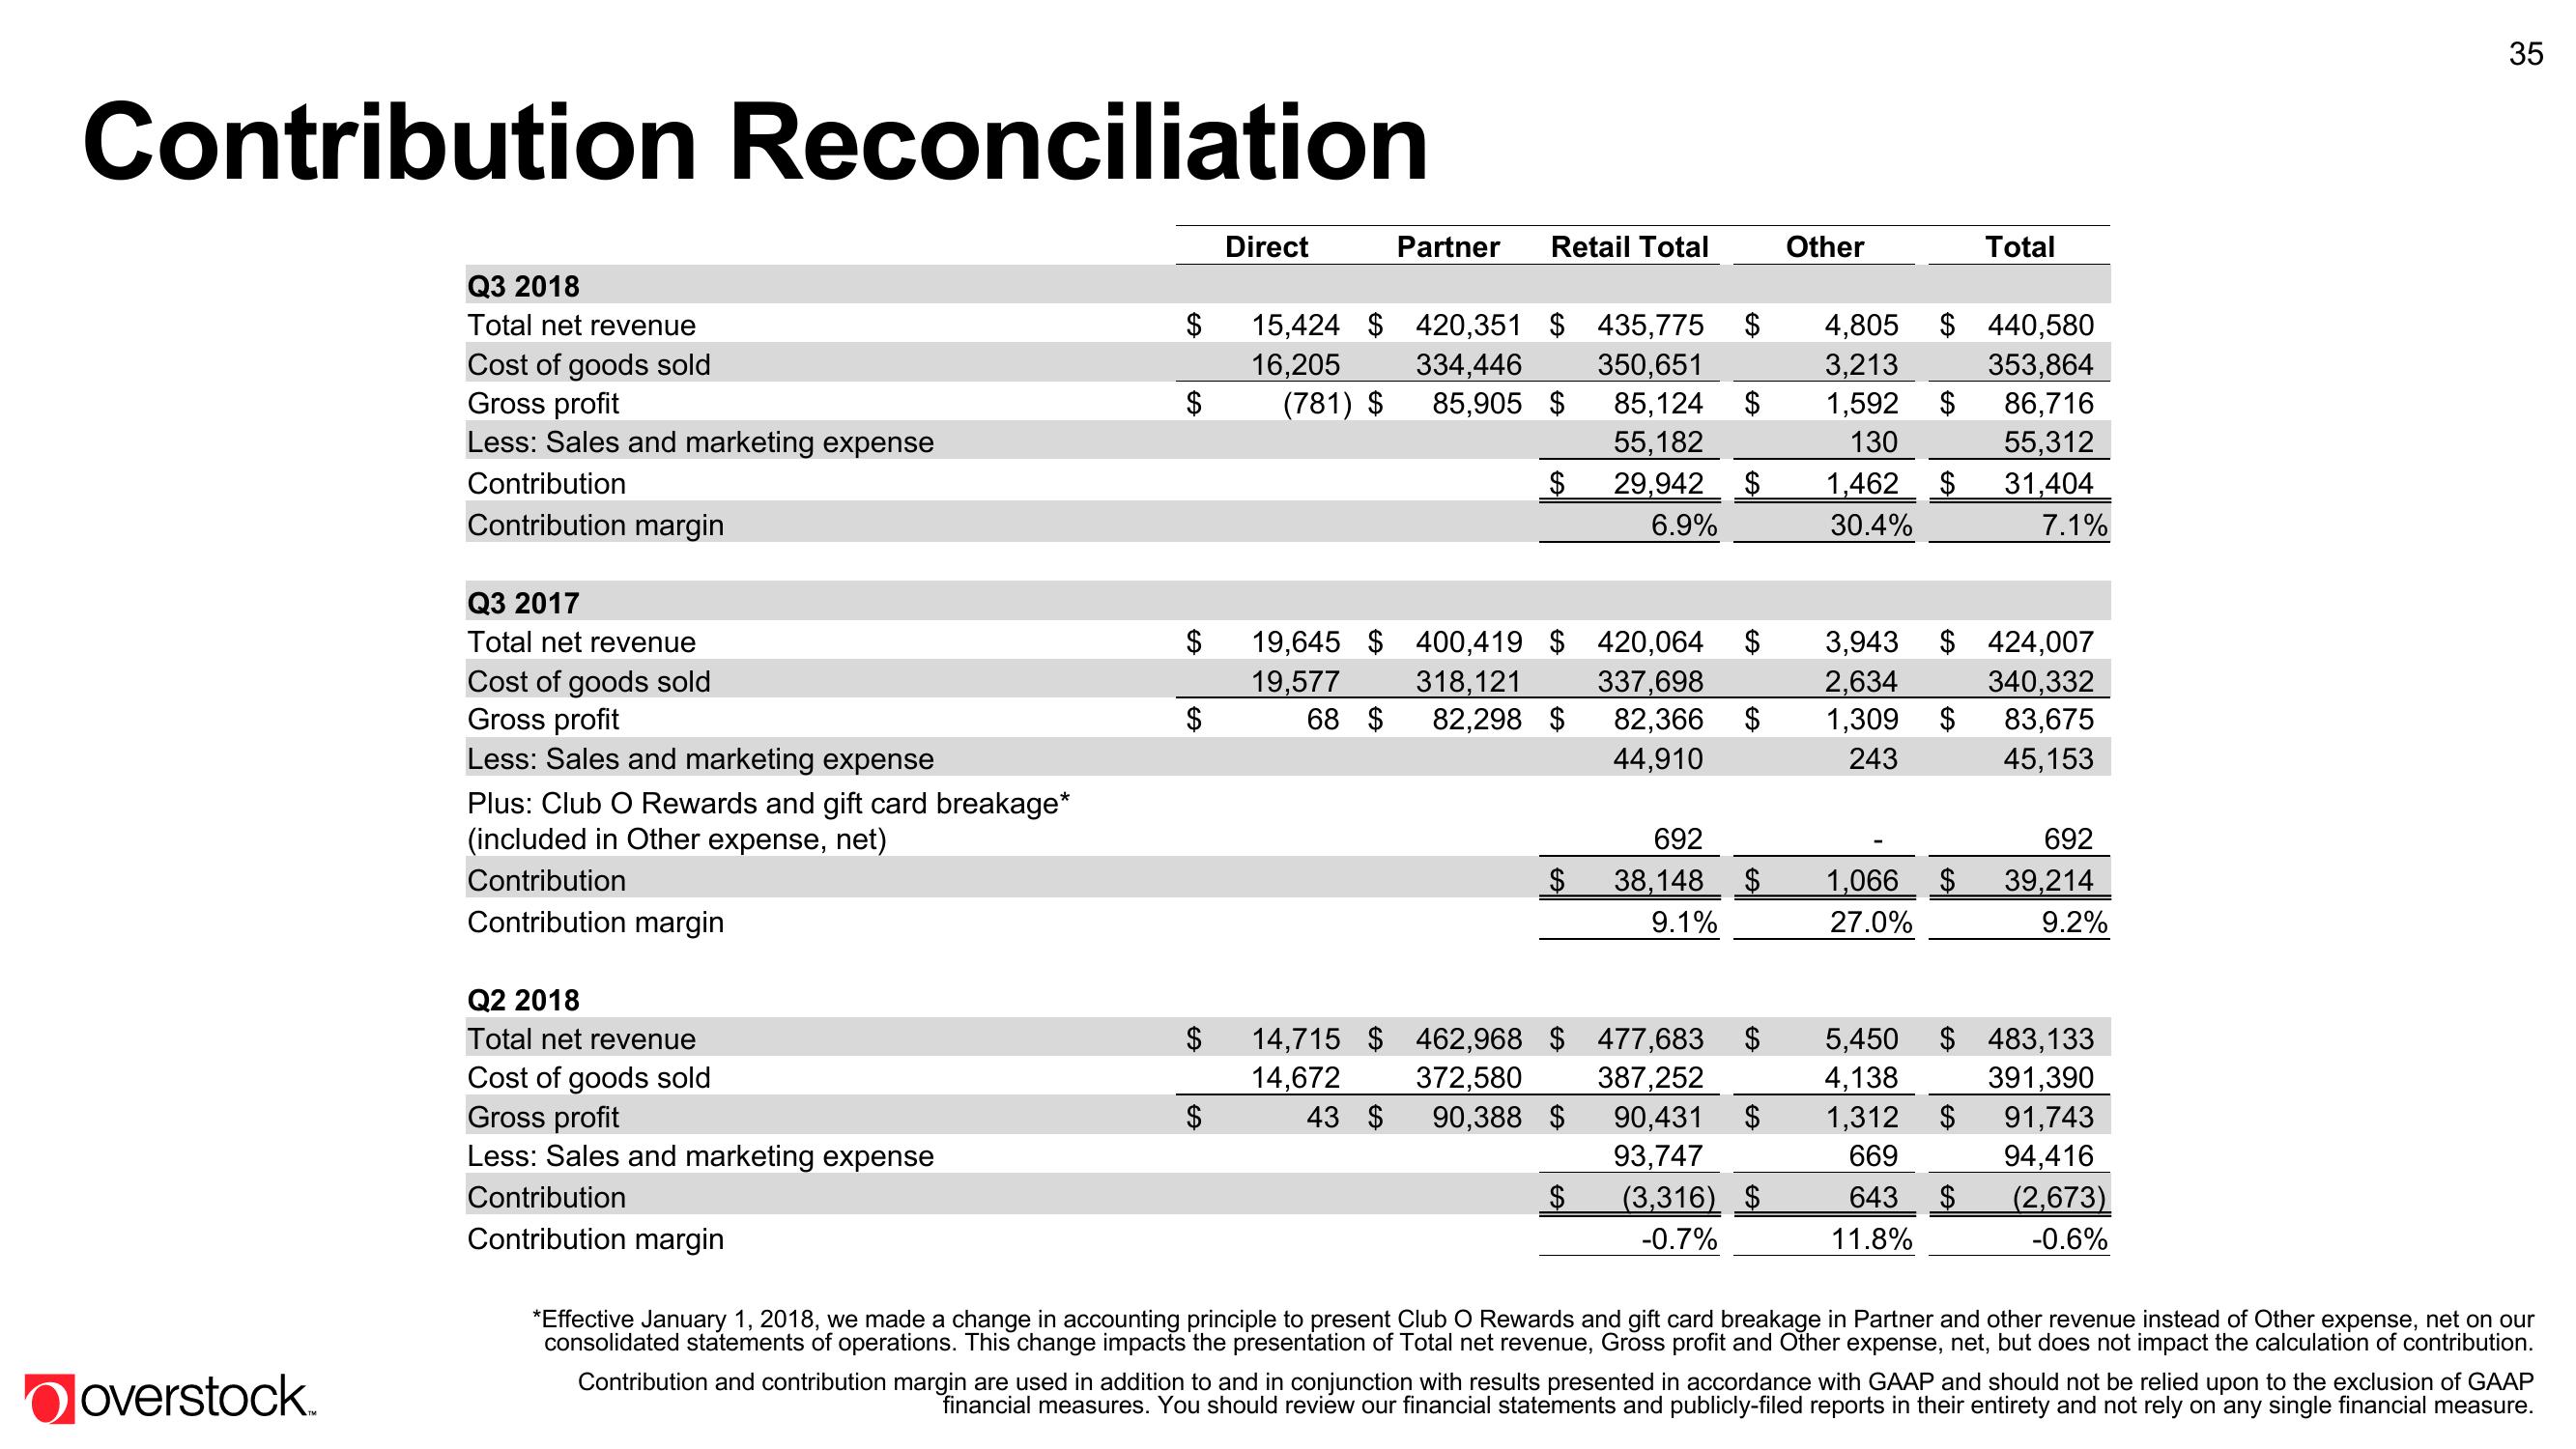
*Effective January 1, 2018, we made a change in accounting principle to present Club O Rewards and gift card breakage in Partner and other revenue instead of Other expense, net on our
consolidated statements of operations. This change impacts the presentation of Total net revenue, Gross profit and Other expense, net, but does not impact the calculation of contribution.
Contribution and contribution margin are used in addition to and in conjunction with results presented in accordance with GAAP and should not be relied upon to the exclusion of GAAP
financial measures. You should review our financial statements and publicly-filed reports in their entirety and not rely on any single financial measure.View entire presentation