OpenText Investor Presentation Deck
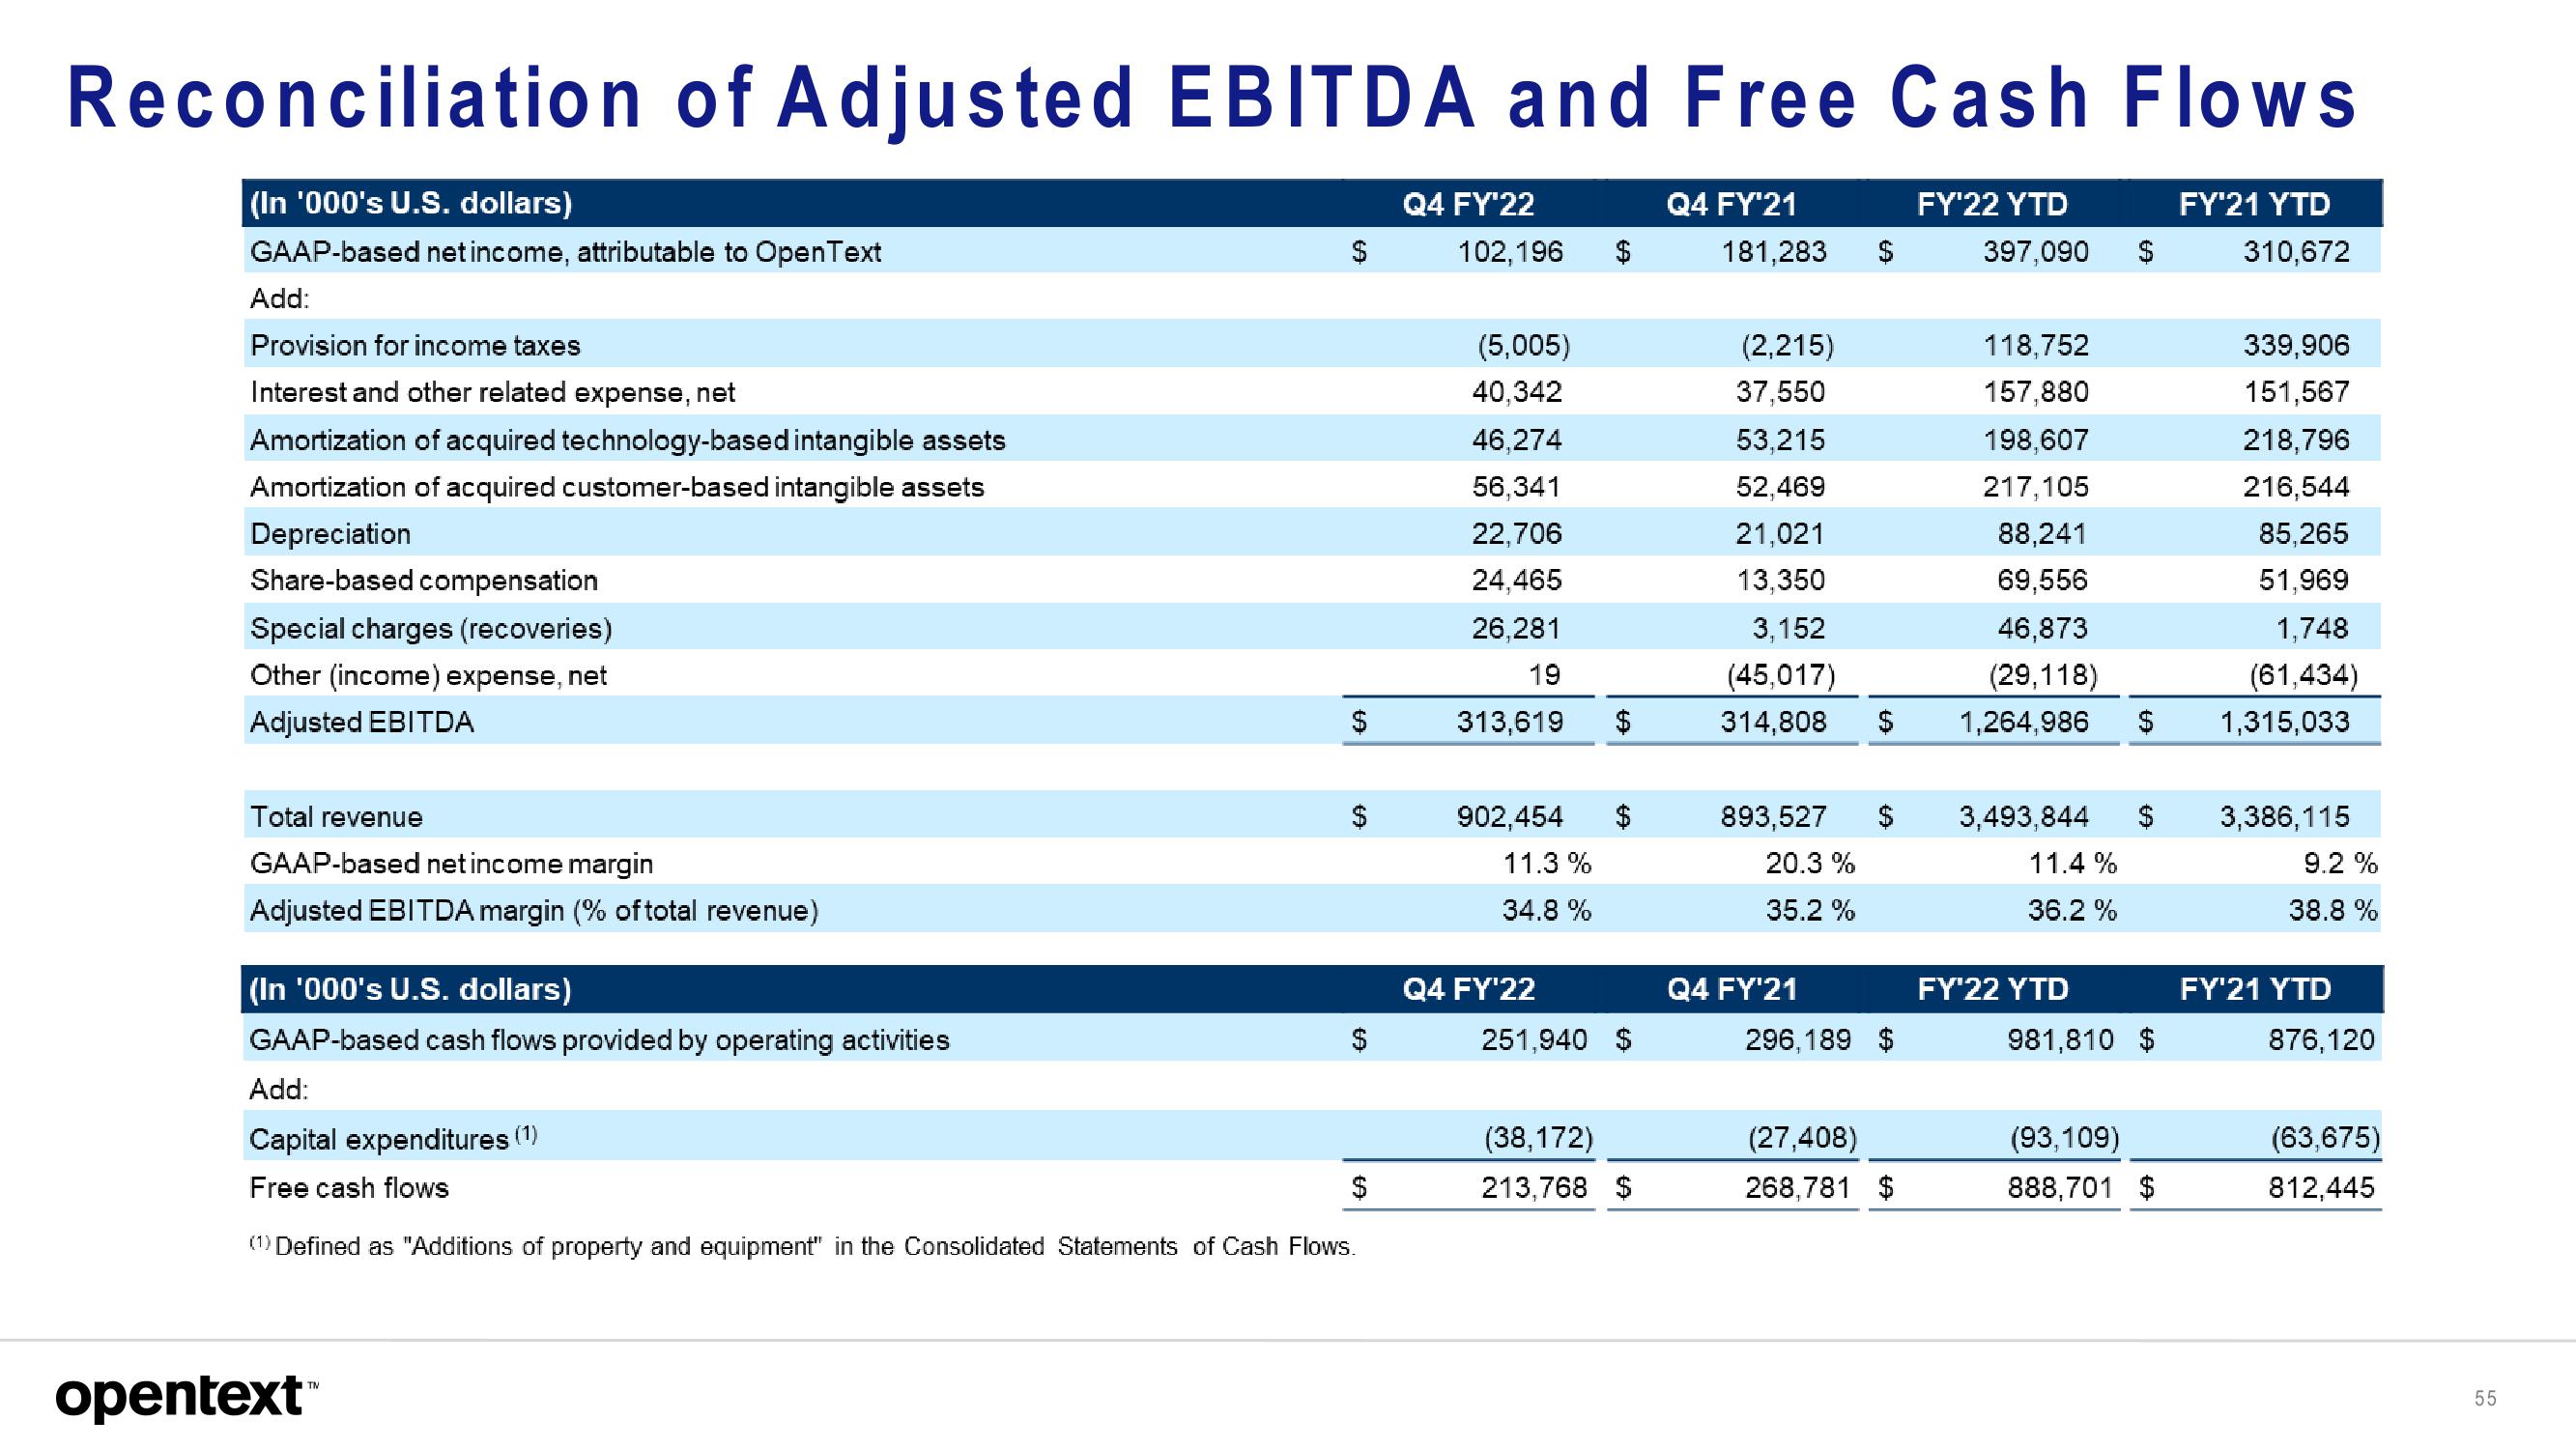
Reconciliation of Adjusted EBITDA and Free Cash Flows
(In '000's U.S. dollars)
GAAP-based net income, attributable to OpenText
Add:
Provision for income taxes
Interest and other related expense, net
Amortization of acquired technology-based intangible assets
Amortization of acquired customer-based intangible assets
Depreciation
Share-based compensation
Special charges (recoveries)
Other (income) expense, net
Adjusted EBITDA
Total revenue
GAAP-based net income margin
Adjusted EBITDA margin (% of total revenue)
(In '000's U.S. dollars)
GAAP-based cash flows provided by operating activities
$
opentext™
(A
$
Add:
Capital expenditures (1)
Free cash flows
(1) Defined as "Additions of property and equipment" in the Consolidated Statements of Cash Flows.
Q4 FY'22
102,196
(5,005)
40,342
46,274
56,341
22,706
24,465
26,281
19
313,619
902,454
11.3%
34.8 %
Q4 FY'22
$
$
251,940 $
(38,172)
213,768 $
Q4 FY'21
181,283
893,527
20.3 %
35.2 %
(2,215)
118,752
37,550
157,880
53,215
198,607
52,469
217,105
21,021
88,241
13,350
69,556
3,152
46,873
(45,017)
(29,118)
314,808 $ 1,264,986
Q4 FY'21
296,189
(27,408)
268,781
FY'22 YTD
$
397,090
3,493,844
11.4%
36.2%
FY'22 YTD
$
981,810 $
(93,109)
888,701 $
FY'21 YTD
310,672
339,906
151,567
218,796
216,544
85,265
51,969
1,748
(61,434)
1,315,033
3,386,115
9.2 %
38.8 %
FY'21 YTD
876,120
(63,675)
812,445
55View entire presentation