Accel Entertaiment Results Presentation Deck
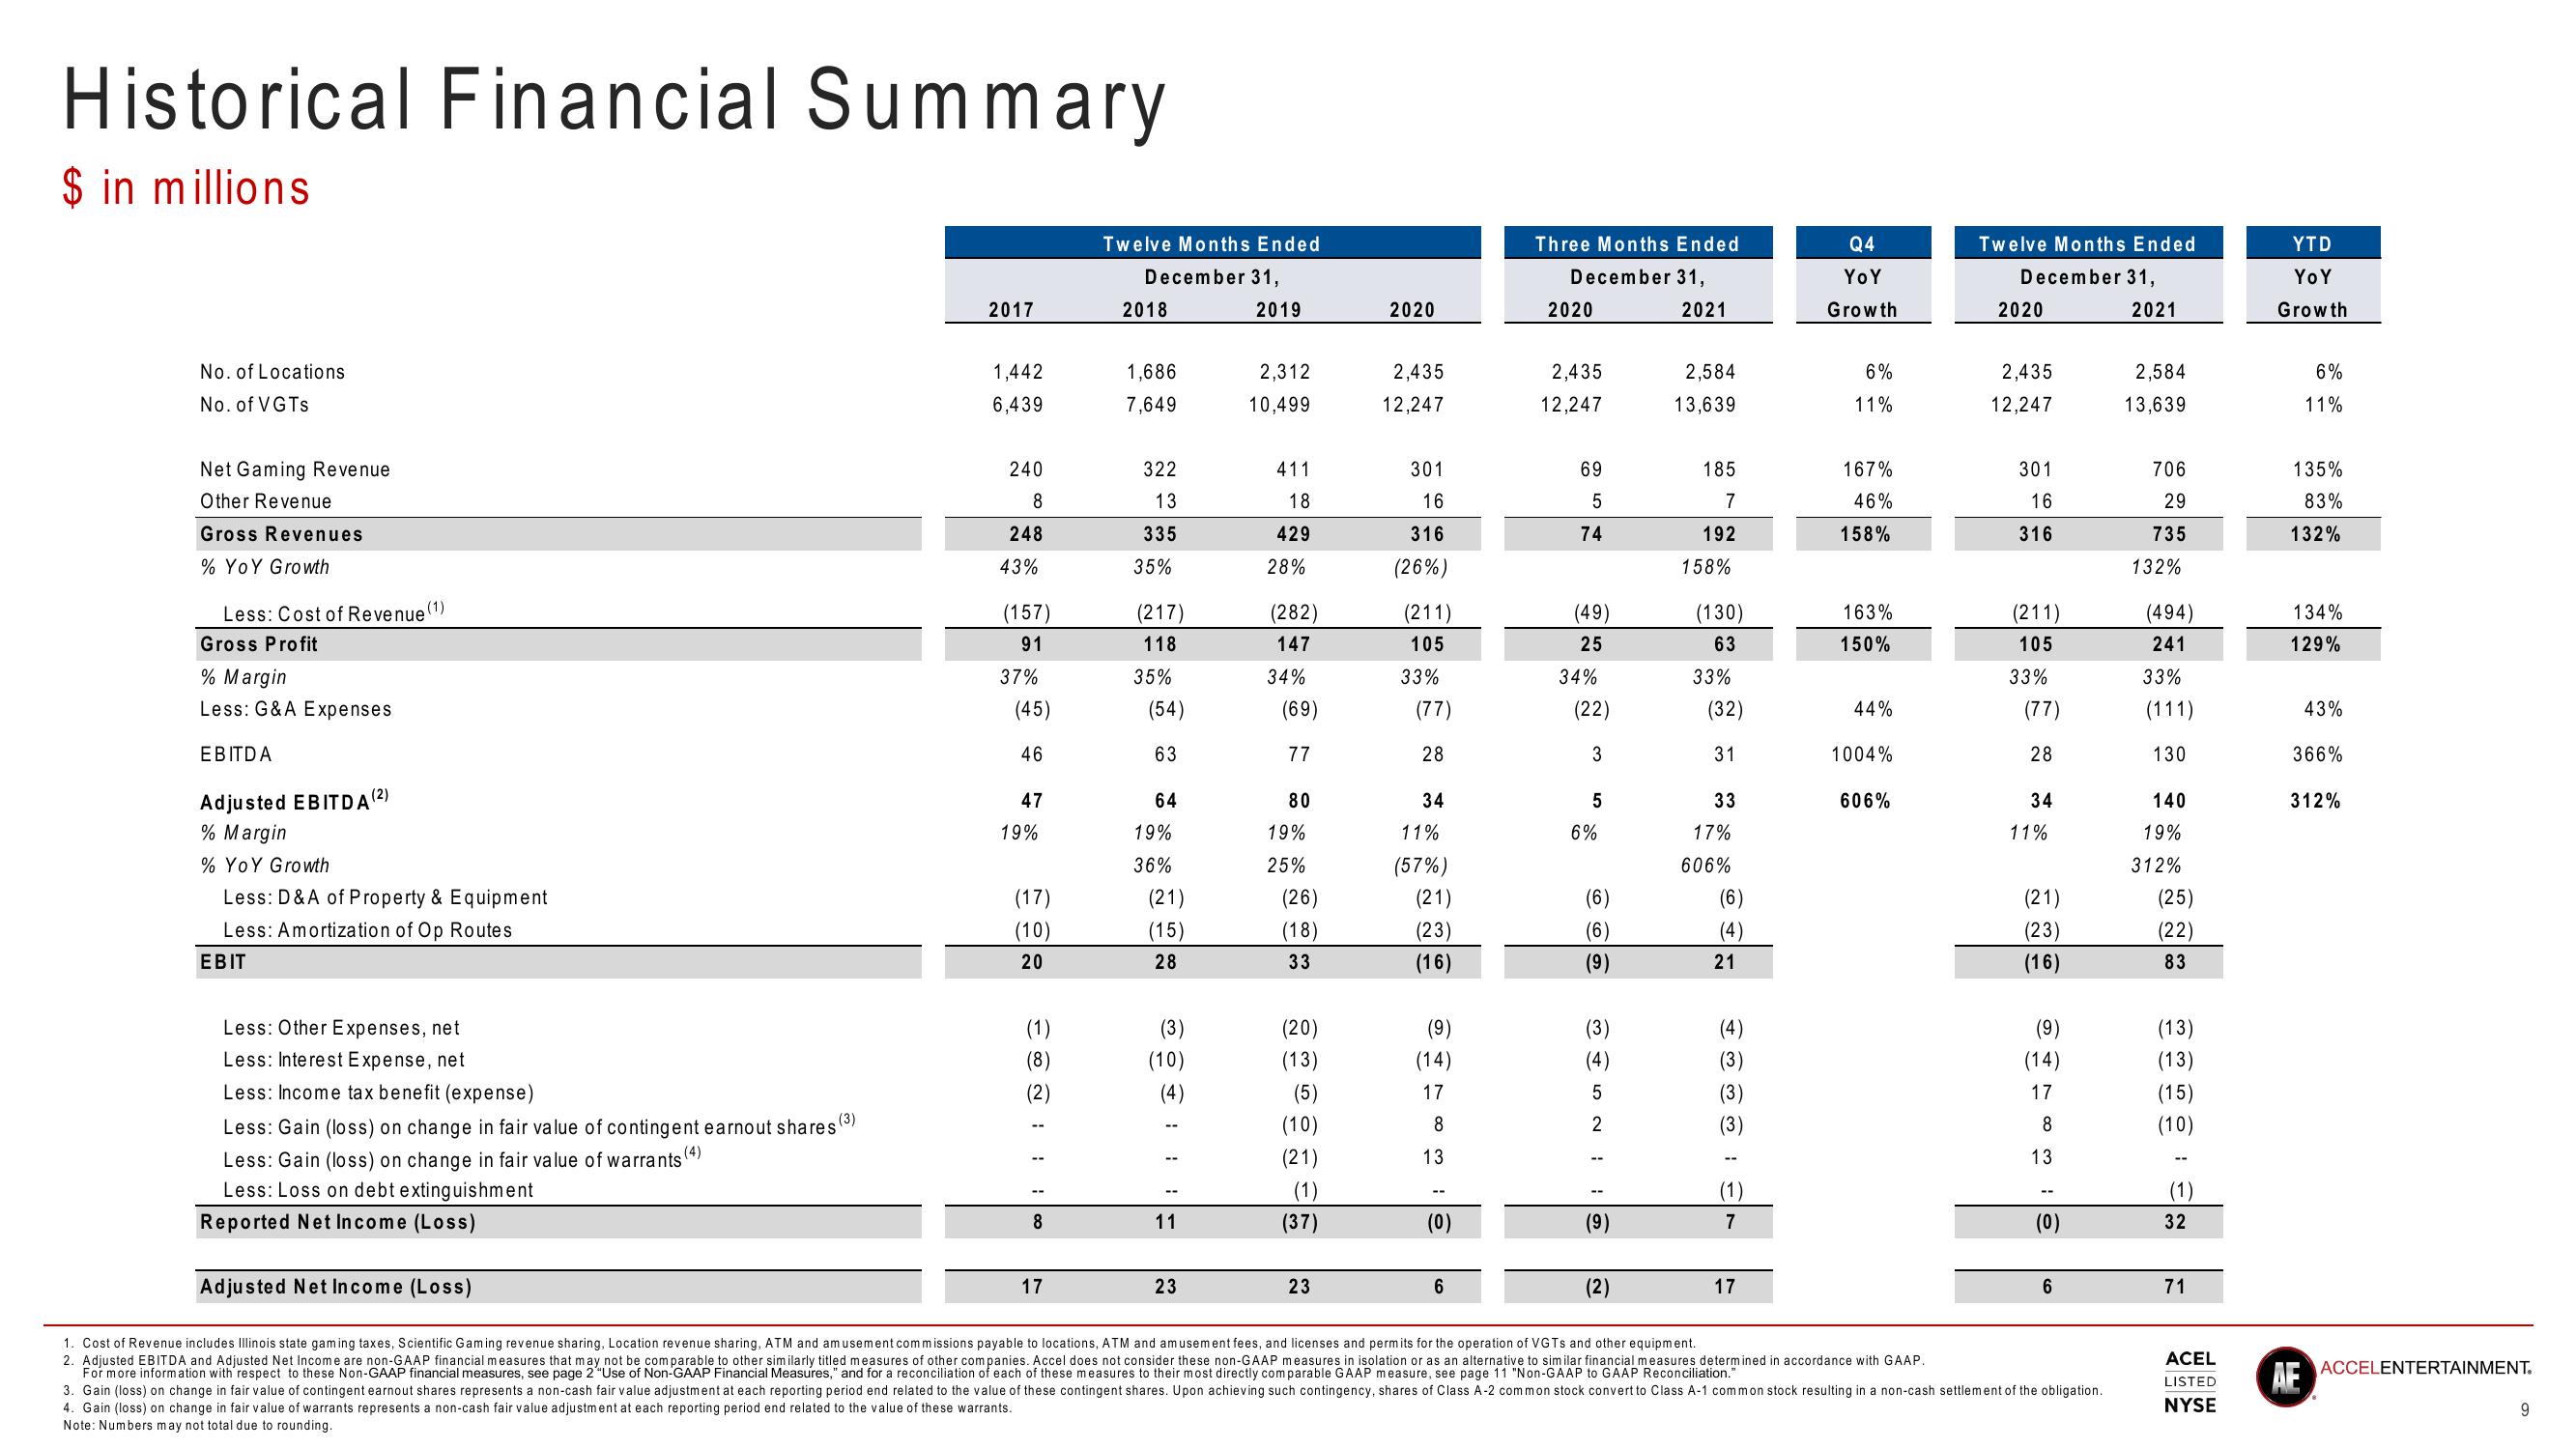
Historical Financial Summary
$ in millions
No. of Locations
No. of VGTs
Net Gaming Revenue
Other Revenue
Gross Revenues
% YoY Growth
Less: Cost of Revenue (1)
Gross Profit
% Margin
Less: G&A Expenses
EBITDA
Adjusted EBITDA (2)
% Margin
% YoY Growth
Less: D&A of Property & Equipment
Less: Amortization of Op Routes
EBIT
Less: Other Expenses, net
Less: Interest Expense, net
Less: Income tax benefit (expense)
(3)
Less: Gain (loss) on change in fair value of contingent earnout shares
Less: Gain (loss) on change in fair value of warrants (4)
Less: Loss on debt extinguishment
Reported Net Income (Loss)
2017
1,442
6,439
240
8
248
43%
(157)
91
37%
(45)
46
47
19%
(17)
(10)
20
(1)
(8)
1 1 I
8
Twelve Months Ended
December 31,
2019
17
2018
1,686
7,649
322
13
335
35%
(217)
118
35%
(54)
63
64
19%
36%
(21)
(15)
28
(3)
(10)
11
2,312
10,499
23
411
18
429
28%
(282)
147
34%
(69)
77
80
19%
25%
(26)
(18)
33
(20)
(13)
(5)
(10)
(21)
(1)
(37)
2020
23
2,435
12,247
301
16
316
(26%)
(211)
105
33%
(77)
28
34
11%
(57%)
(21)
(23)
(16)
(9)
(14)
17
8
13
--
(0)
Three Months Ended
December 31,
2021
6
2020
2,435
12,247
69
5
74
(49)
25
34%
(22)
3
5
6%
(6)
(6)
(9)
(3)
(4)
5
2
(9)
2,584
13,639
(2)
185
7
192
158%
(130)
63
33%
(32)
31
33
17%
606%
(6)
(4)
21
(4)
(3)
(3)
(3)
(1)
7
Q4
Yo Y
Growth
Adjusted Net Income (Loss)
1. Cost of Revenue includes Illinois state gaming taxes, Scientific Gaming revenue sharing, Location revenue sharing, ATM and amusement commissions payable to locations, ATM and amusement fees, and licenses and permits for the operation of VGTs and other equipment.
2. Adjusted EBITDA and Adjusted Net Income are non-GAAP financial measures that may not be comparable to other similarly titled measures of other companies. Accel does not consider these non-GAAP measures in isolation or as an alternative to similar financial measures determined in accordance with GAAP.
For more information with respect to these Non-GAAP financial measures, see page 2 "Use of Non-GAAP Financial Measures," and for a reconciliation of each of these measures to their most directly comparable GAAP measure, see page 11 "Non-GAAP to GAAP Reconciliation."
17
6%
11%
167%
46%
158%
163%
150%
44%
1004%
606%
Twelve Months Ended
December 31,
2021
2020
2,435
12,247
301
16
316
(211)
105
33%
(77)
28
34
11%
(21)
(23)
(16)
(9)
(14)
17
8
13
(0)
6
3. Gain (loss) on change in fair value of contingent earnout shares represents a non-cash fair value adjustment at each reporting period end related to the value of these contingent shares. Upon achieving such contingency, shares of Class A-2 common stock convert to Class A-1 common stock resulting in a non-cash settlement of the obligation.
4. Gain (loss) on change in fair value of warrants represents a non-cash fair value adjustment at each reporting period end related to the value of these warrants.
Note: Numbers may not total due to rounding.
2,584
13,639
706
29
735
132%
(494)
241
33%
(111)
130
140
19%
312%
(25)
(22)
83
(13)
(13)
(15)
(10)
32
71
ACEL
LISTED
NYSE
YTD
Yo Y
Growth
6%
11%
135%
83%
132%
134%
129%
43%
366%
312%
AE
ACCELENTERTAINMENT.
9View entire presentation