Melrose Results Presentation Deck
£m
750
650
550
450
350
250
150
50
-50
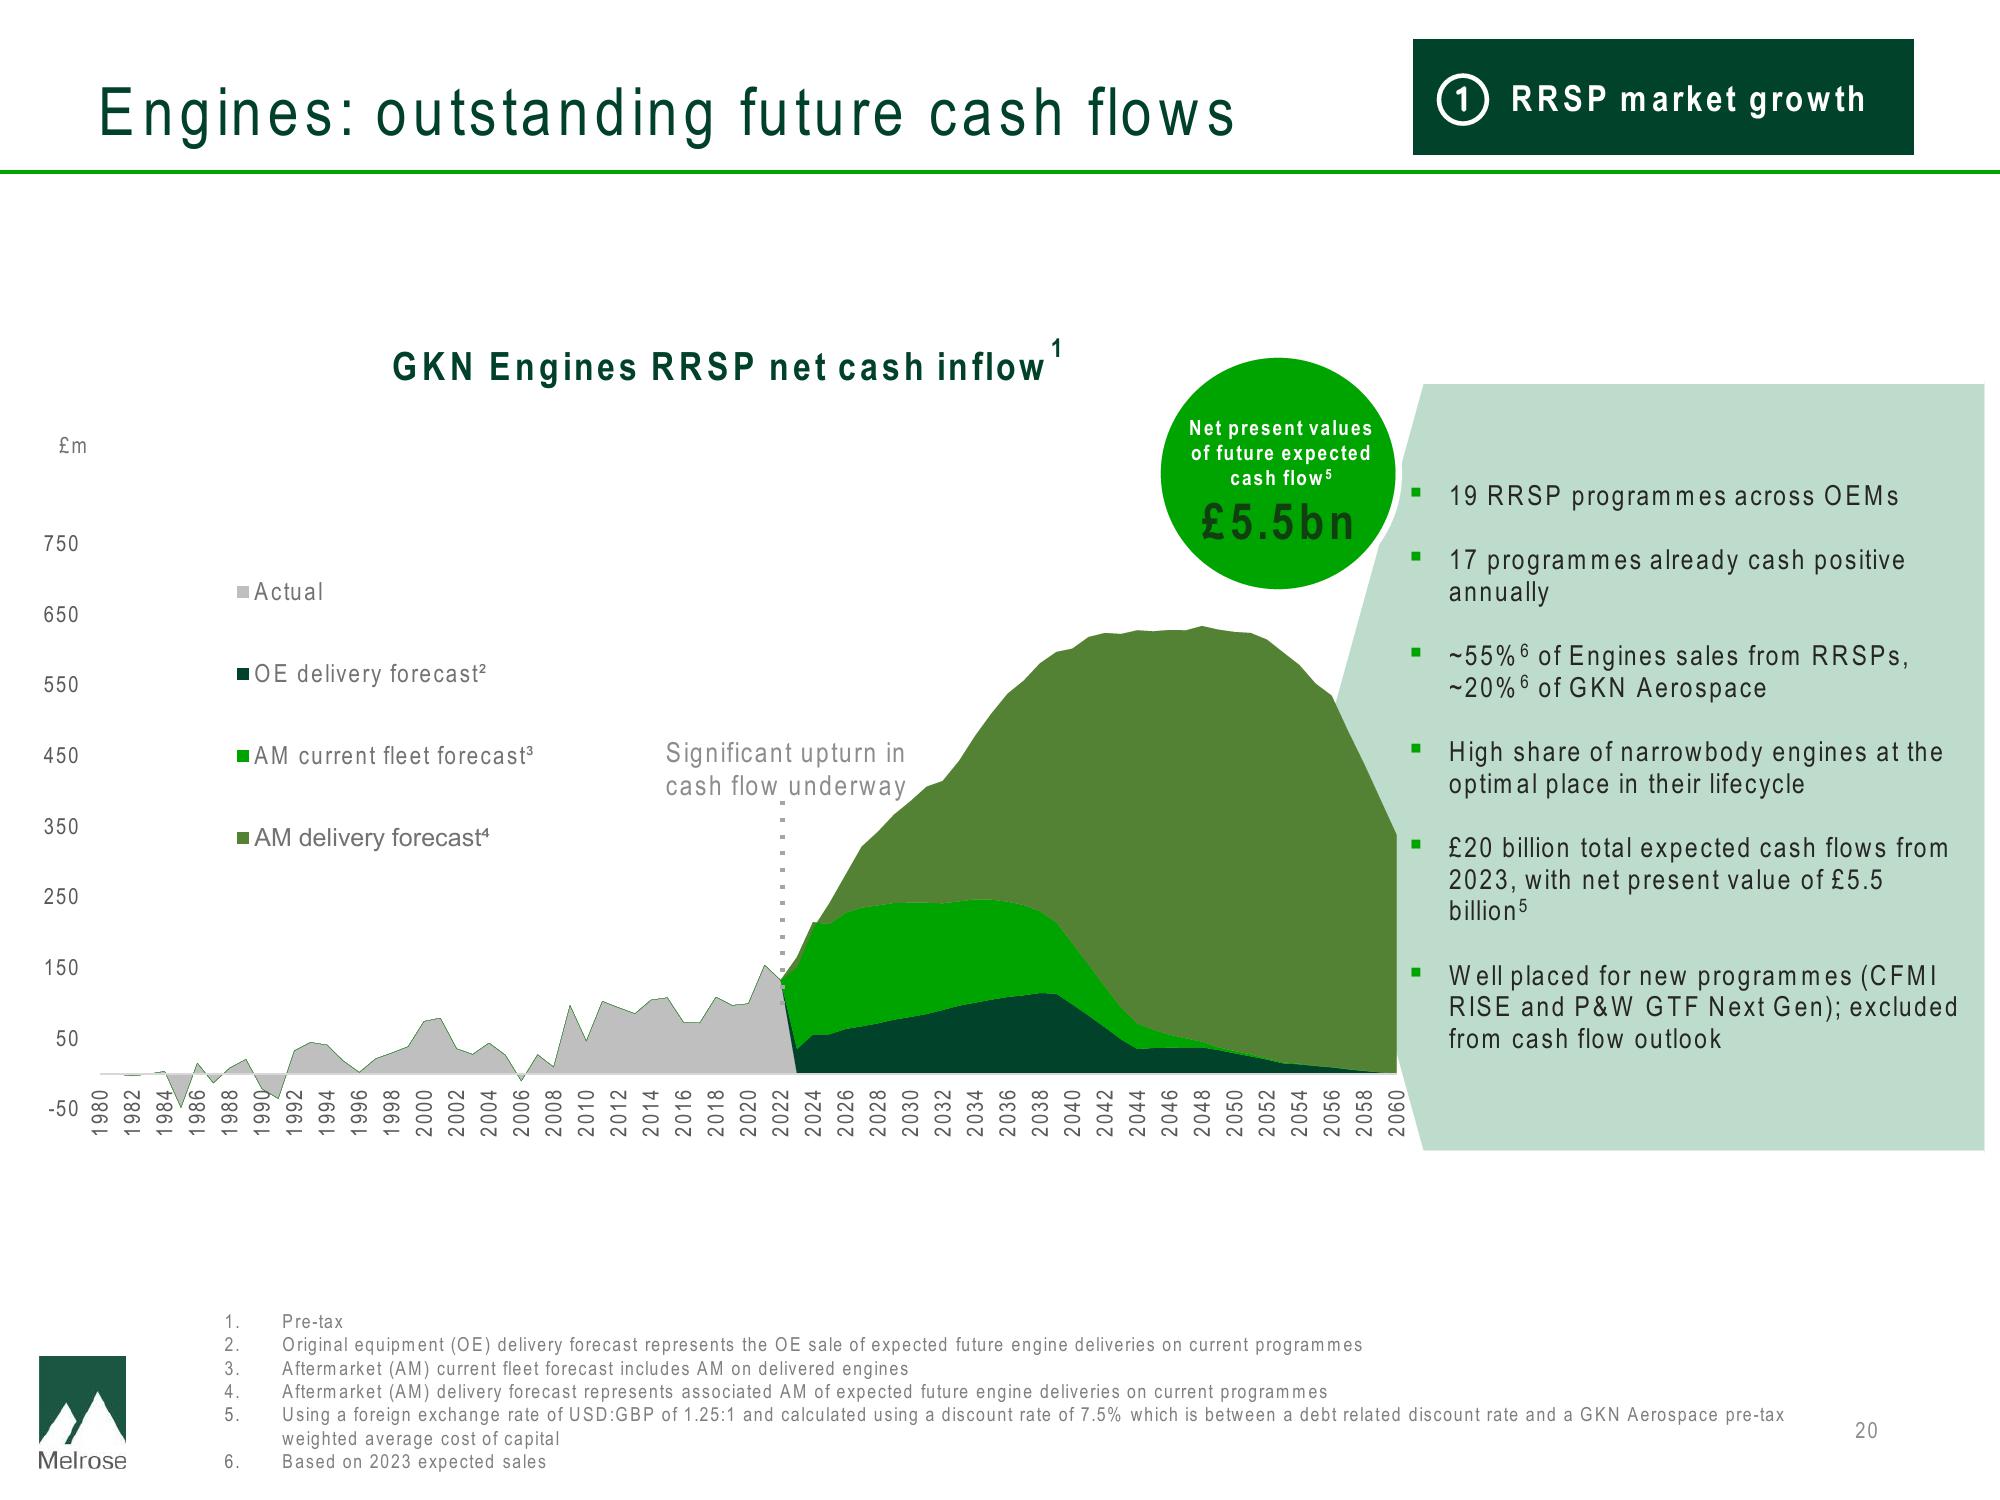
Engines: outstanding future cash flows
1980
1982
1984
Melrose
you
000
1986
■OE delivery forecast²
1988
■AM current fleet forecast³
Actual
■AM delivery forecast4
www
1.
2.
3.
4.
5.
6.
666
1992
1994
GKN Engines RRSP net cash inflow
900k
1996
000k
1998
0007
2000
2002
20
www
2004
0003
2006
0007
2008
2010
0107
7107
2012
Significant upturn in
cash flow underway
2014
2016
P
2018
2010
2020
0707
2022
2022
2024
2024
2026
2026
Be
2028
2028
2030
2032
2034
2036
2038
2040
2042
3103
LLOZ
2044
Net present values
of future expected
cash flow 5
£5.5bn
D
2046
2048
CLOT
2007
2050
2052
2002
2054
2056
2058
2060
Pre-tax
Original equipment (OE) delivery forecast represents the OE sale of expected future engine deliveries on current programmes
Aftermarket (AM) current fleet forecast includes AM on delivered engines
■
RRSP market growth
19 RRSP programmes across OEMs
17 programmes already cash positive
annually
▪ ~55% of Engines sales from RRSPs,
-20% of GKN Aerospace
▪ High share of narrowbody engines at the
optimal place in their lifecycle
■ £20 billion total expected cash flows from
2023, with net present value of £5.5
billion 5
▪ Well placed for new programmes (CFMI
RISE and P&W GTF Next Gen); excluded
from cash flow outlook
Aftermarket (AM) delivery forecast represents associated AM of expected future engine deliveries on current programmes
Using a foreign exchange rate of USD:GBP of 1.25:1 and calculated using a discount rate of 7.5% which is between a debt related discount rate and a GKN Aerospace pre-tax
weighted average cost of capital
Based on 2023 expected sales
20View entire presentation