Sonos Results Presentation Deck
Our Current Install Base Continues to Purchase Additional Sonos Products
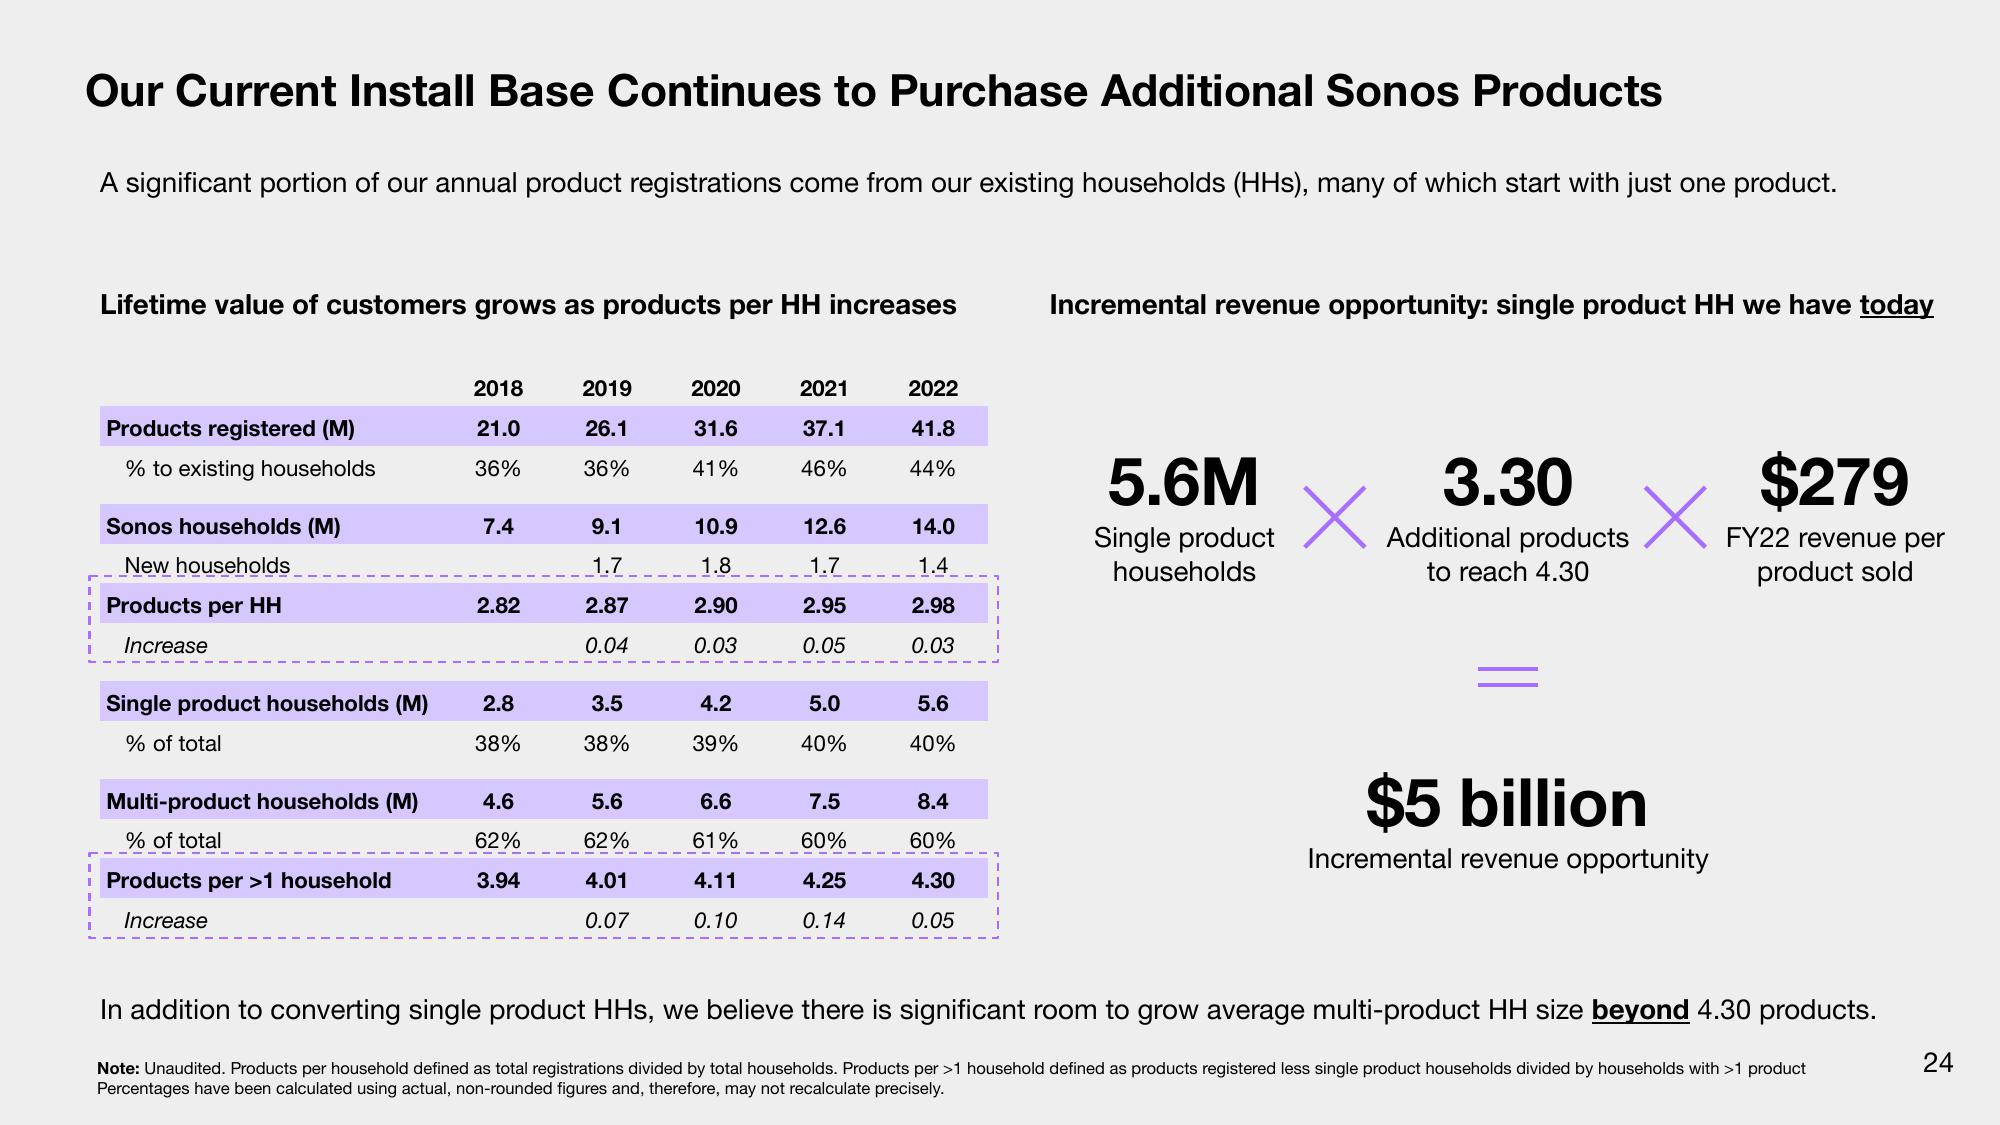
A significant portion of our annual product registrations come from our existing households (HHs), many of which start with just one product.
Lifetime value of customers grows as products per HH increases
Products registered (M)
% to existing households
Sonos households (M)
New households
Products per HH
Increase
Single product households (M)
% of total
Multi-product households (M)
% of total
Products per >1 household
Increase
2018
21.0
36%
7.4
2.82
2.8
38%
4.6
62%
3.94
2019
26.1
36%
9.1
1.7
2.87
0.04
3.5
38%
5.6
62%
4.01
0.07
2020
31.6
41%
10.9
1.8
2.90
0.03
4.2
39%
6.6
61%
4.11
0.10
2021
37.1
46%
12.6
1.7
2.95
0.05
5.0
40%
7.5
60%
4.25
0.14
2022
41.8
44%
14.0
1.4
2.98
0.03
5.6
40%
8.4
60%
4.30
0.05
Incremental revenue opportunity: single product HH we have today
5.6M
Single product
households
x
3.30
Additional products X
to reach 4.30
$5 billion
Incremental revenue opportunity
$279
FY22 revenue per
product sold
In addition to converting single product HHs, we believe there is significant room to grow average multi-product HH size beyond 4.30 products.
Note: Unaudited. Products per household defined as total registrations divided by total households. Products per >1 household defined as products registered less single product households divided by households with >1 product
Percentages have been calculated using actual, non-rounded figures and, therefore, may not recalculate precisely.
24View entire presentation