Baird Investment Banking Pitch Book
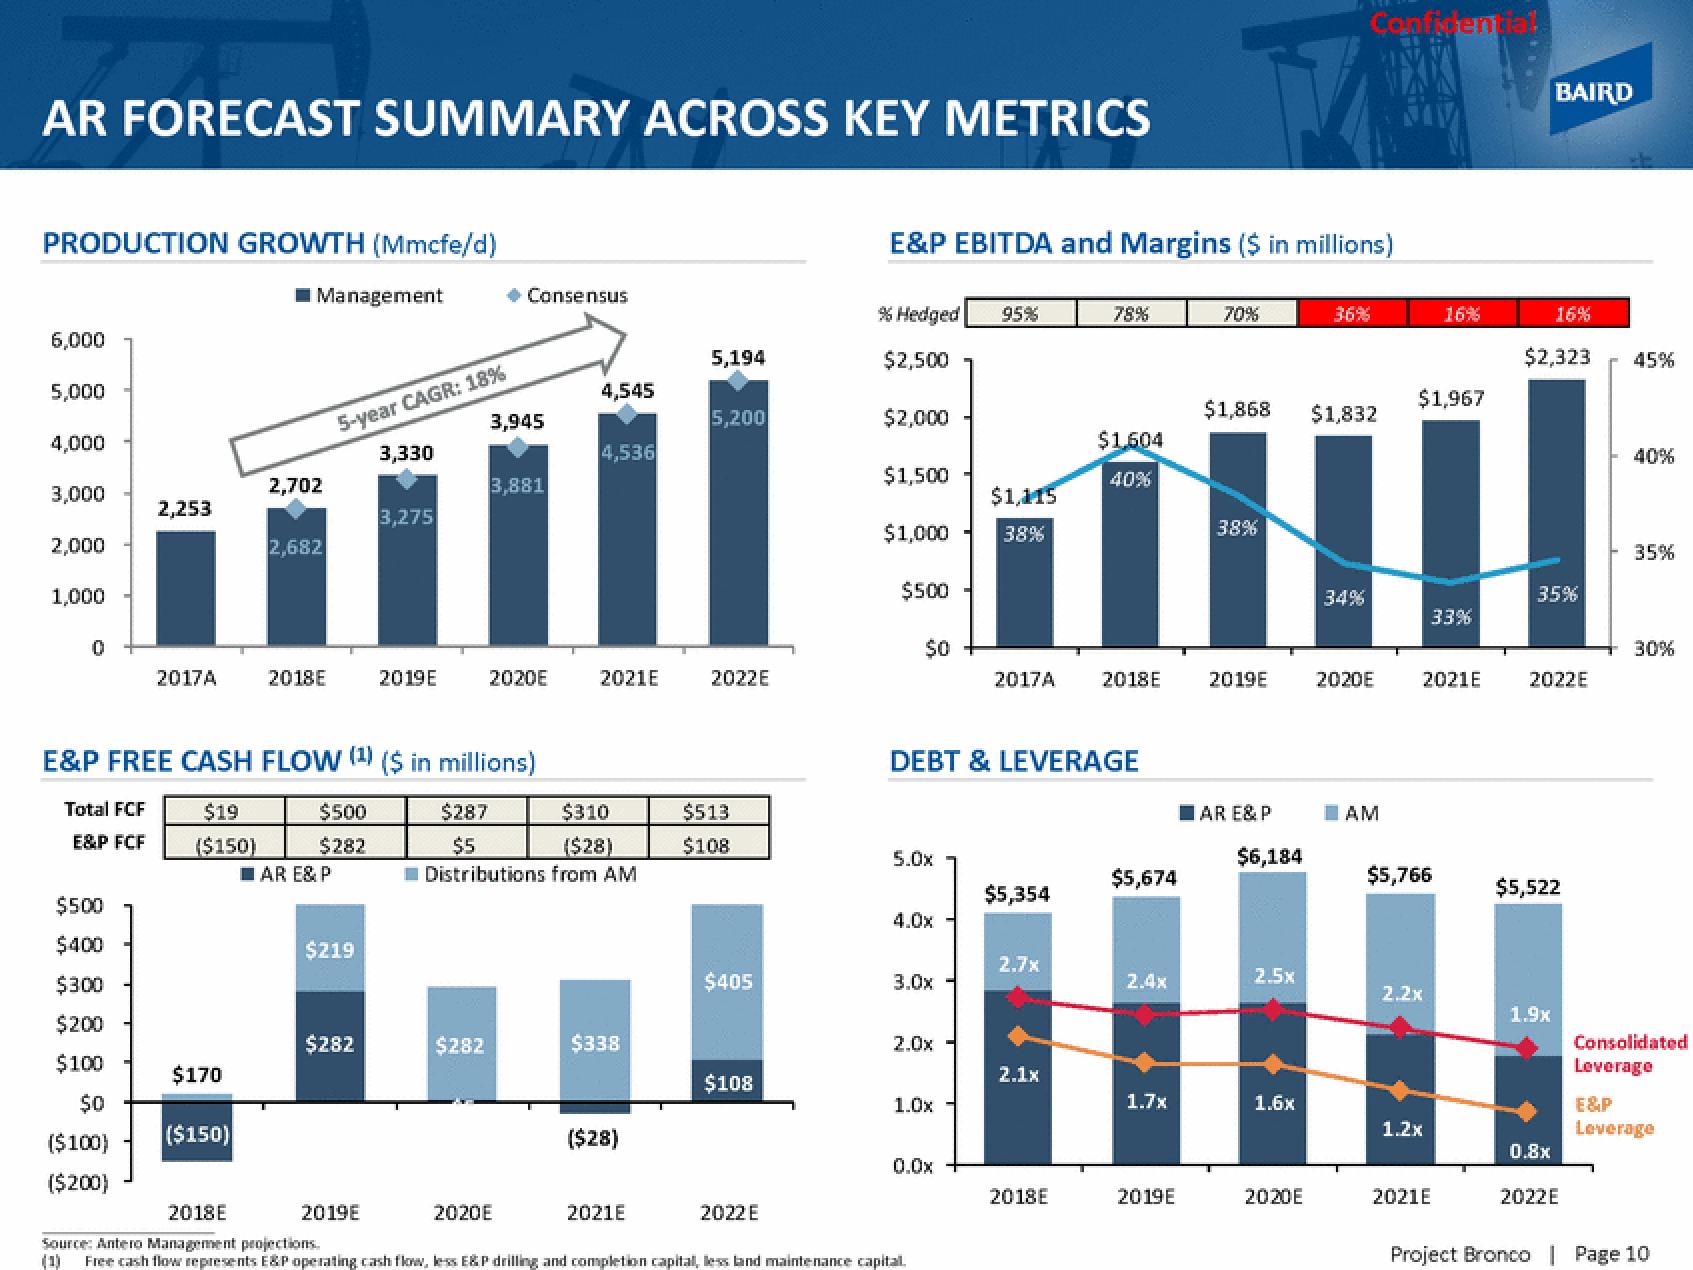
AR FORECAST SUMMARY ACROSS KEY METRICS
PRODUCTION GROWTH (Mmcfe/d)
6,000
5,000
4,000
3,000
2,000
1,000
0
2,253
$500
$400
$300
$200
$100
$0
($100)
($200)
2017A
$170
■Management
($150)
2,702
2,682
2018E
$500
$282
AR E& P
5-year CAGR: 18%
$219
E&P FREE CASH FLOW (¹) ($ in millions)
Total FCF
$19
($150)
E&P FCF
$282
3,330
3,275
2019E
2019E
$287
$5
→ Consensus
3,945
$282
3,881
2020E
Distributions from
2020E
4,545
4,536
2021E
$310
($28)
$338
($28)
2021E
5,194
5,200
2022E
$513
$108
$405
$108
2022 E
E&P EBITDA and Margins ($ in millions)
% Hedged
$2,500
$2,000
$1,500
$1,000
$500
$0
5.0x
4.0x
2018E
Source: Antero Management projections.
Free cash flow represents E&P operating cash flow, less E&P drilling and completion capital, less land maintenance capital.
(1)
3.0x -
2.0x
1.0x
DEBT & LEVERAGE
0.0x
95%
$1,115
38%
2017A
$5,354
2.7x
2.1x
78%
2018E
$1,604
40%
2018E
$5,674
2.4x
1.7x
2019E
70%
$1,868
38%
2019E
AR E& P
$6,184
2.5x
1.6x
2020E
Confidential
36%
$1,832
34%
2020E
AM
$1,967
2021E
$5,766
2.2x
16%
33%
1.2x
2021E
BAIRD
$2,323
16%
35%
2022E
1.9x
$5,522
0.8x
2022E
45%
40%
35%
30%
Consolidated
Leverage
E&P
Leverage
Project Bronco | Page 10View entire presentation