Paysafe SPAC Presentation Deck
Strong operating leverage: Growth at scale
Operating leverage
Adj Opex(¹)(2)
as % of
organic
revenue (¹):
●
(1)
(2)
(3)
(4)
(5)
30%
19.6%
13.2%
32%
5.3%
(0.7%)
2019A 2020E
30%
Organic revenue(1)(2) YoY growth
10.4%
4.6%
2021 E
29%
10.7%
5.9%
2022E
28%
11.6%
8.5%
2023E
Organic Adj.
EBITDA
margin(¹)(2):
Adj. Operating expenses (¹)(2) YoY growth
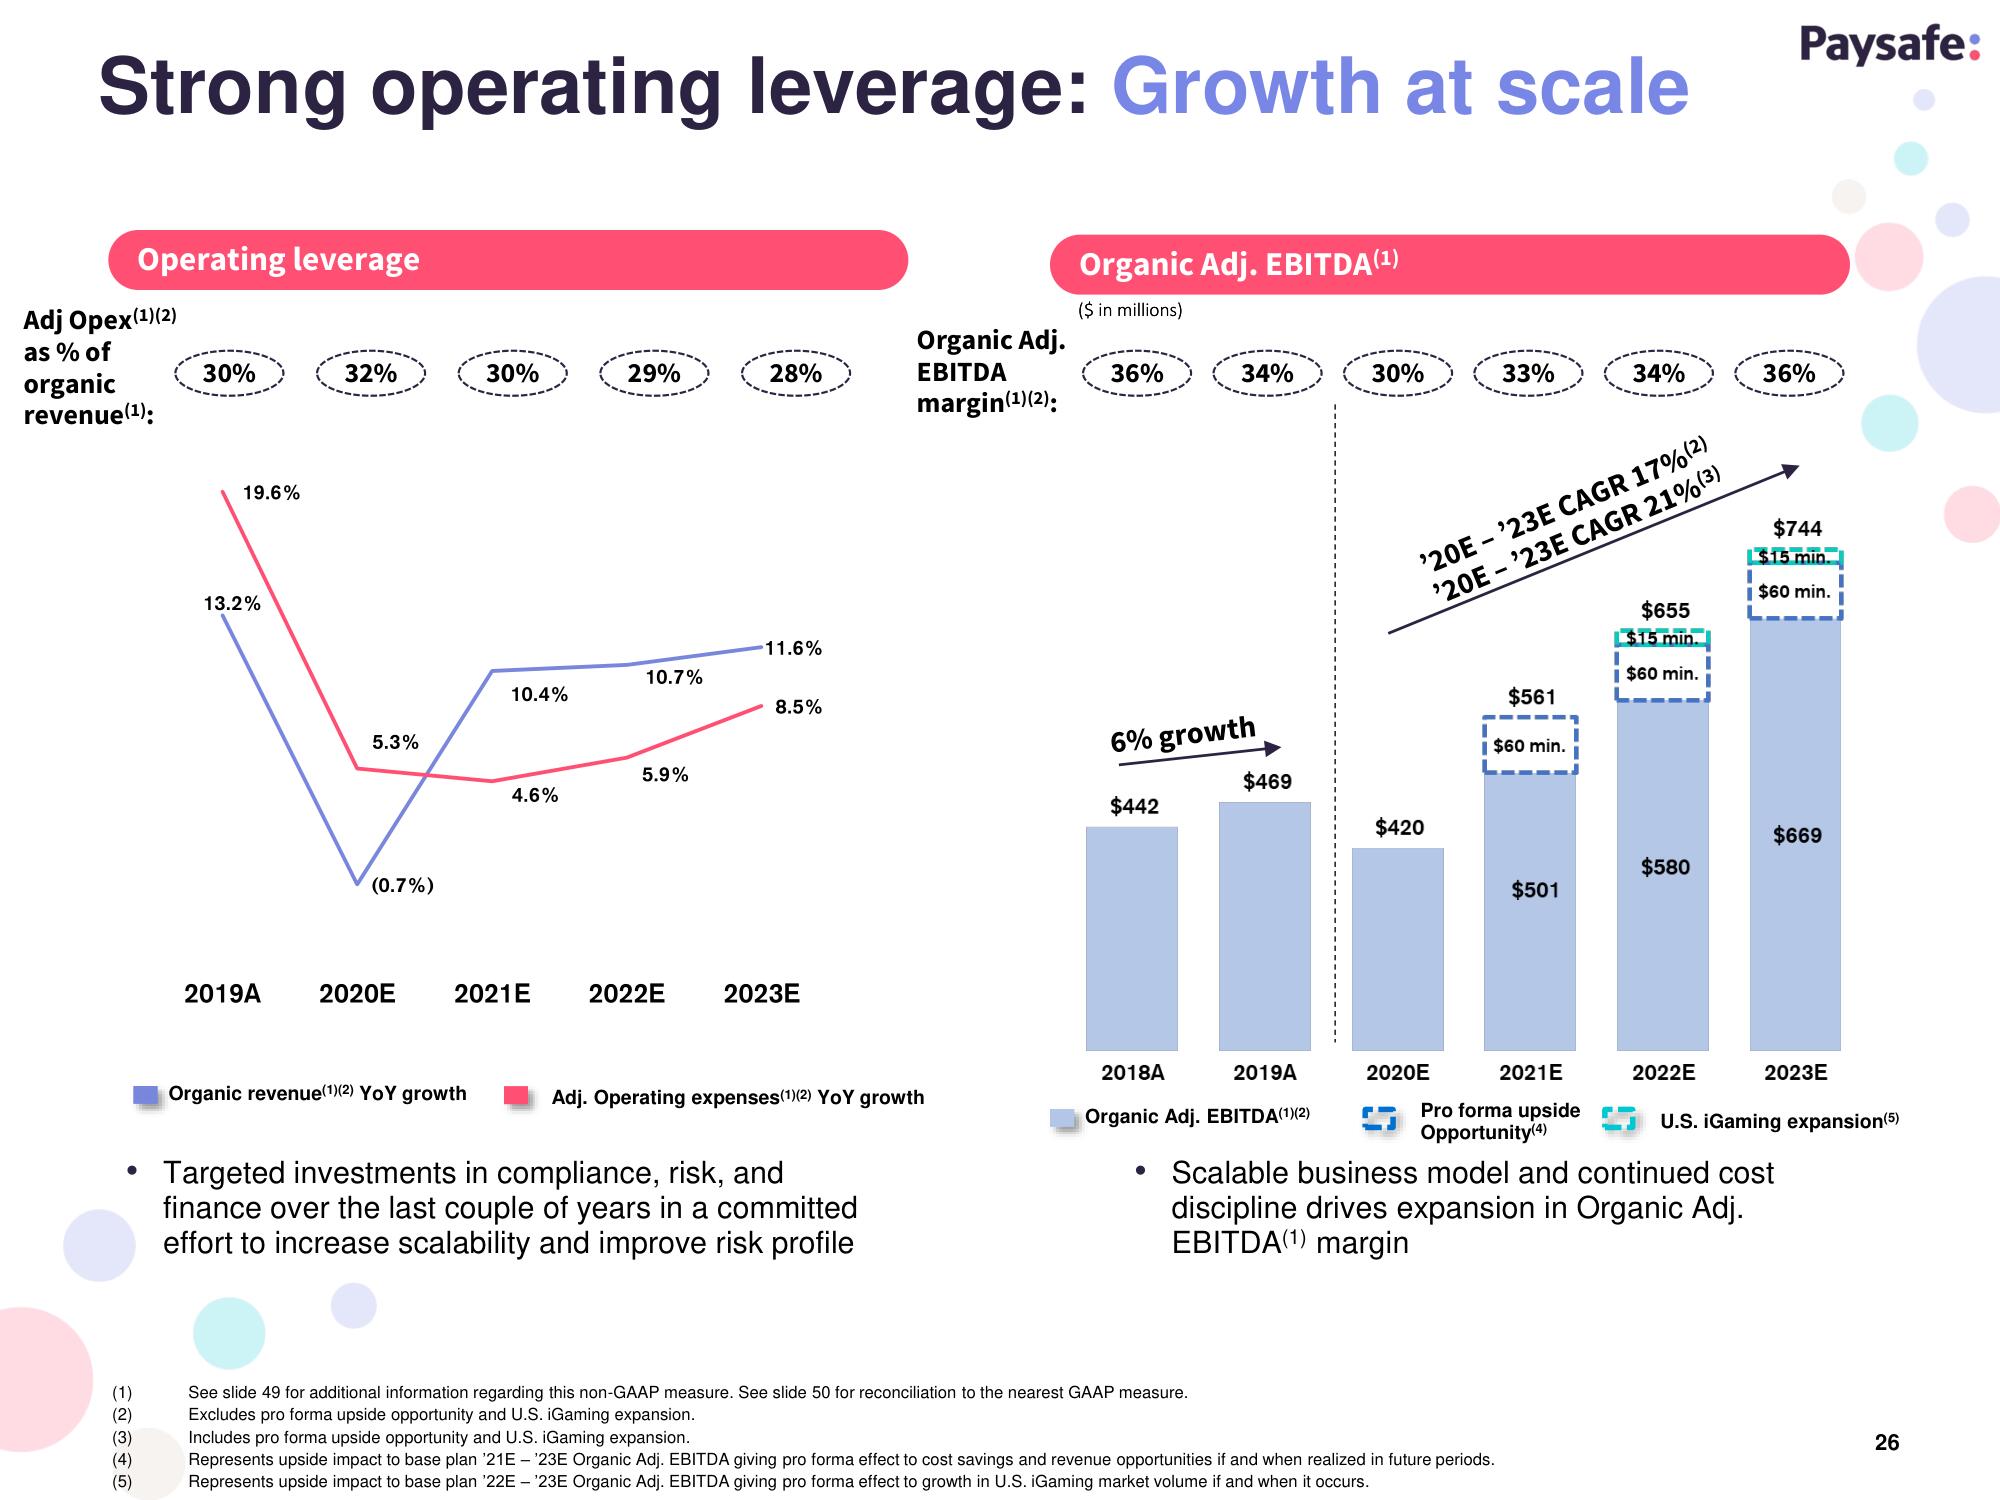
Targeted investments in compliance, risk, and
finance over the last couple of years in a committed
effort to increase scalability and improve risk profile
Organic Adj. EBITDA (¹)
($ in millions)
36%
34%
6% growth
$442
$469
2018A
2019A
Organic Adj. EBITDA(1)(2)
30%
$420
'20E -'23E CAGR 17%(2)
'20E-'23E CAGR 21% (³)
2020E
33%
$561
$60 min.
See slide 49 for additional information regarding this non-GAAP measure. See slide 50 for reconciliation to the nearest GAAP measure.
Excludes pro forma upside opportunity and U.S. iGaming expansion.
Includes pro forma upside opportunity and U.S. iGaming expansion.
Represents upside impact to base plan '21E - '23E Organic Adj. EBITDA giving pro forma effect to cost savings and revenue opportunities if and when realized in future periods.
Represents upside impact to base plan '22E - ¹23E Organic Adj. EBITDA giving pro forma effect to growth in U.S. iGaming market volume if and when it occurs.
$501
2021E
Pro forma upside
Opportunity (4)
34%
$655
$15 min.
i $60 min.
$580
2022E
Paysafe:
36%
$744
$15 min.
I
I $60 min.
$669
2023E
• Scalable business model and continued cost
discipline drives expansion in Organic Adj.
EBITDA(1) margin
U.S. iGaming expansion (5)
26View entire presentation