Morgan Stanley Investment Banking Pitch Book
Morgan Stanley
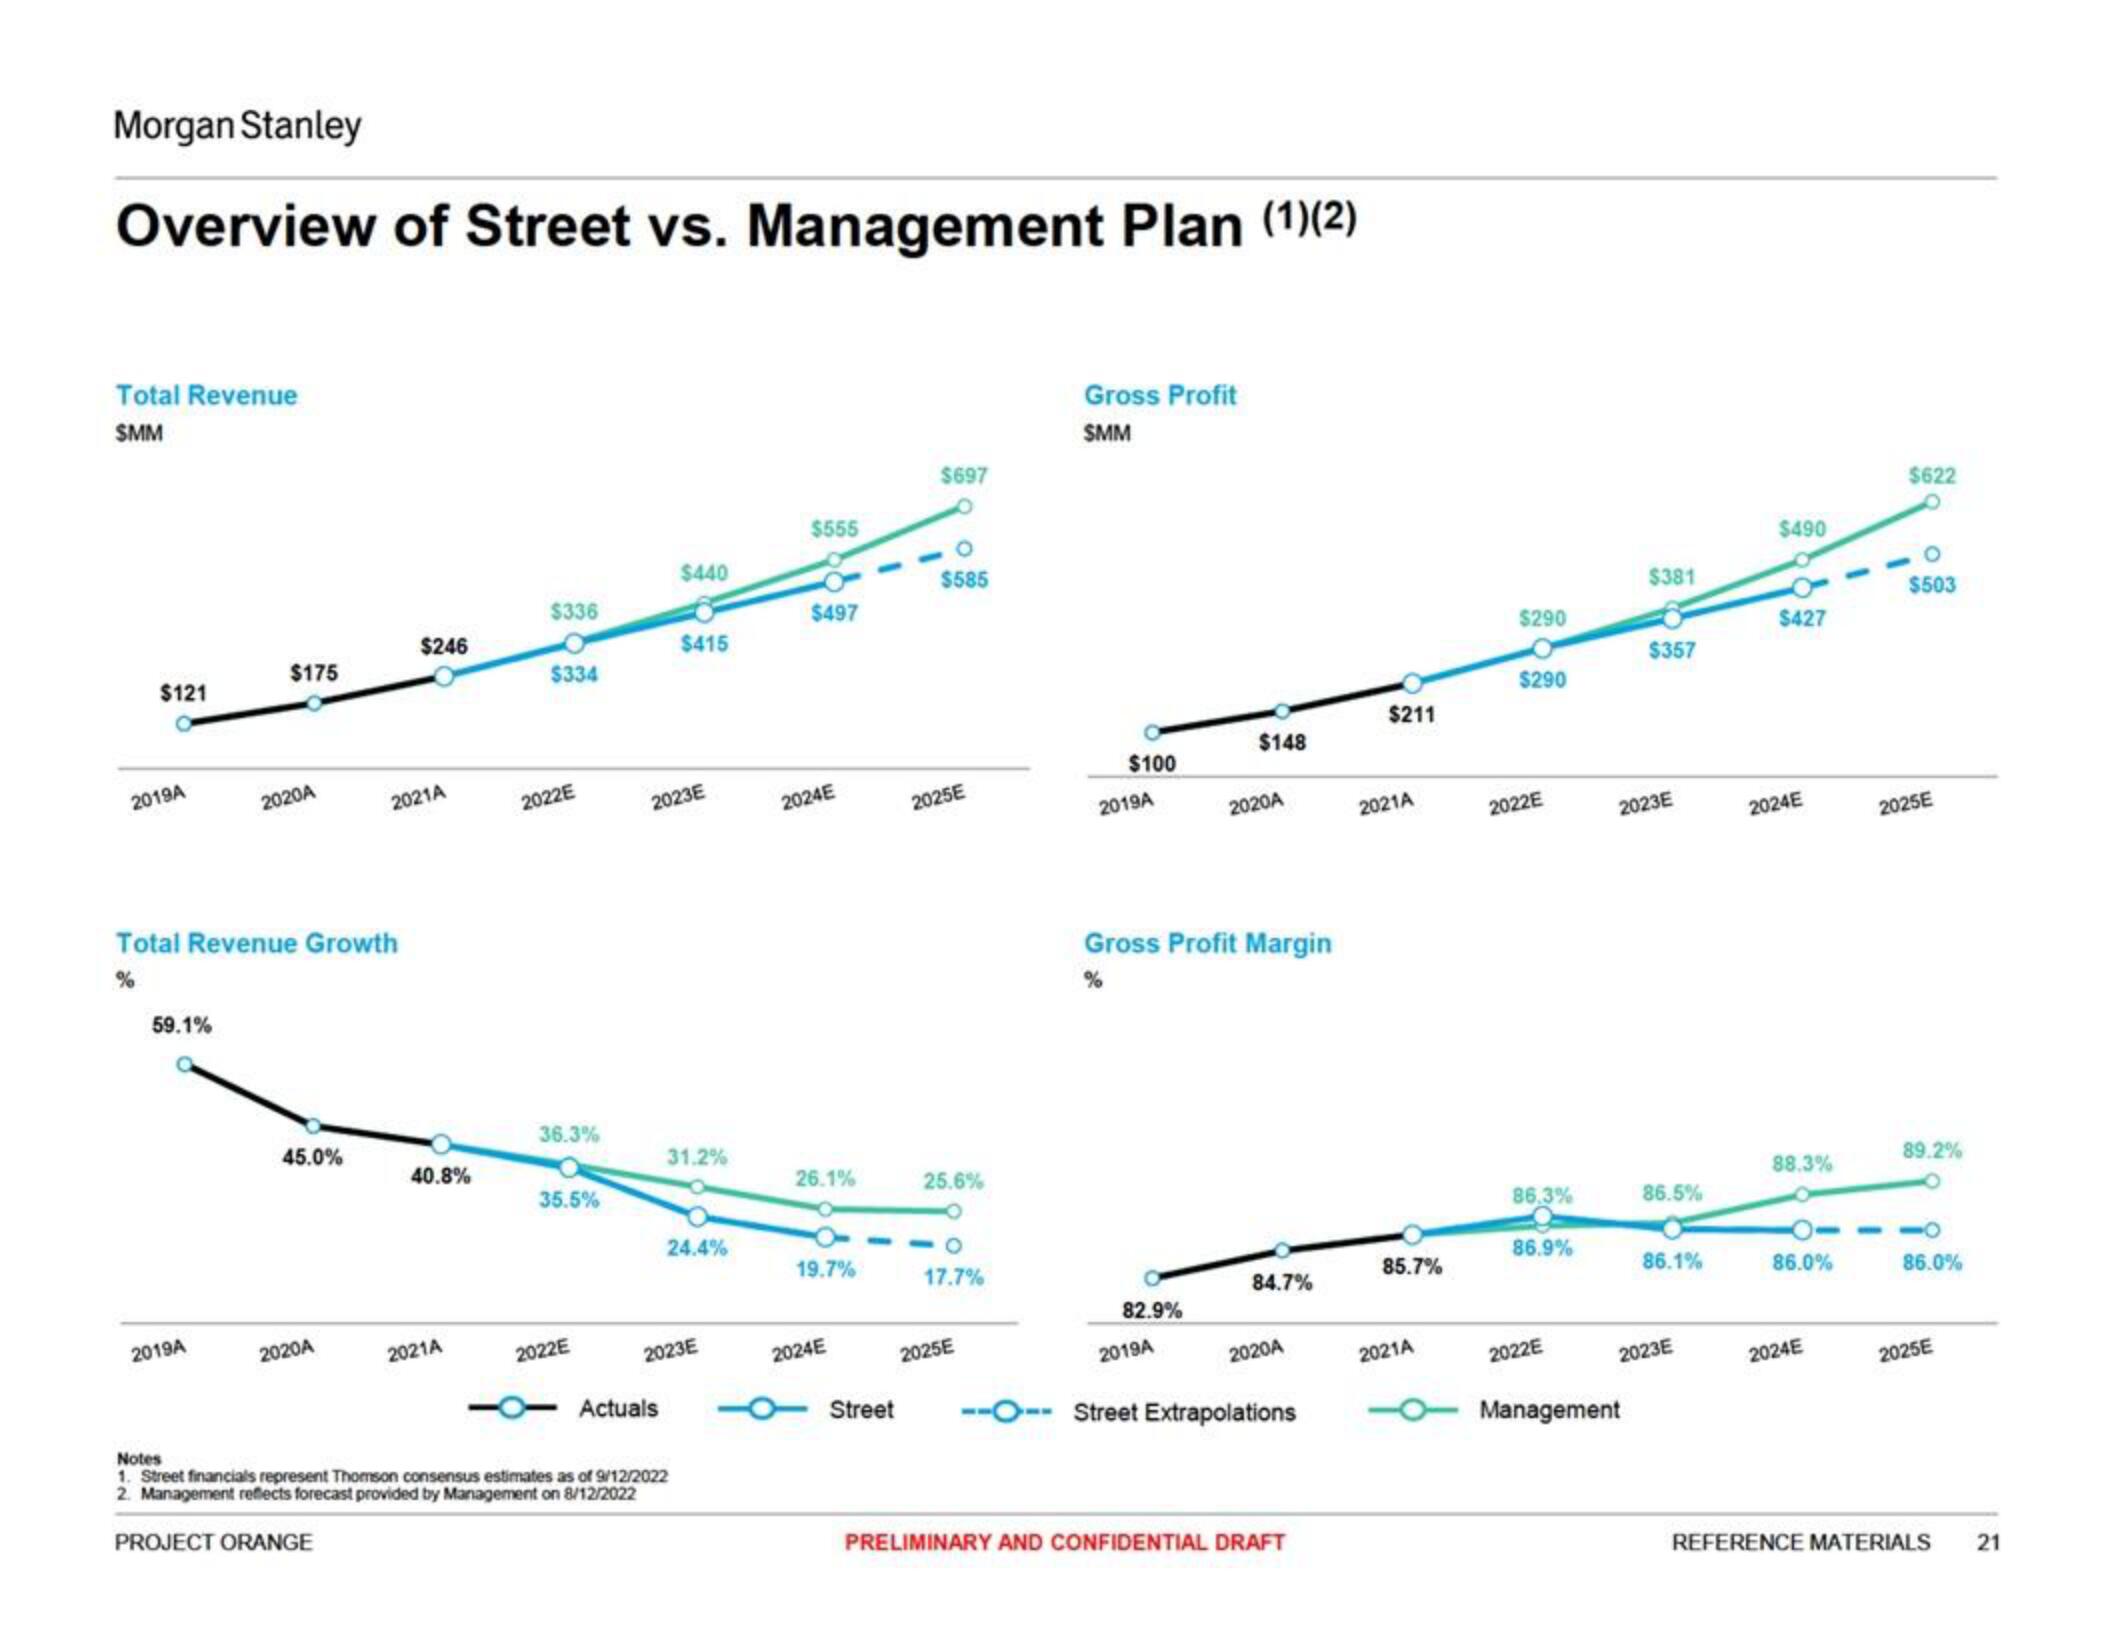
Overview of Street vs. Management Plan (1)(2)
Total Revenue
SMM
$121
2019A
59.1%
$175
2019A
2020A
Total Revenue Growth
%
45.0%
2020A
$246
2021A
40.8%
2021A
$336
$334
2022E
36.3%
35.5%
2022E
$440
2023E
Actuals
$415
31.2%
24.4%
2023E
Notes
1. Street financials represent Thomson consensus estimates as of 9/12/2022
2. Management reflects forecast provided by Management on 8/12/2022
PROJECT ORANGE
$555
$497
2024E
26.1%
19.7%
2024E
Street
$697
$585
2025E
25.6%
17.7%
2025E
Gross Profit
SMM
$100
2019A
82.9%
$148
Gross Profit Margin
2019A
2020A
84.7%
2020A
-O-- Street Extrapolations
PRELIMINARY AND CONFIDENTIAL DRAFT
$211
2021A
85.7%
2021A
$290
$290
2022E
86.3%
86.9%
2022E
$381
$357
2023E
Management
86.5%
86.1%
2023E
$490
$427
2024E
88.3%
86.0%
2024E
$622
$503
2025E
89.2%
86.0%
2025E
REFERENCE MATERIALS
21View entire presentation