Hydrafacial Results Presentation Deck
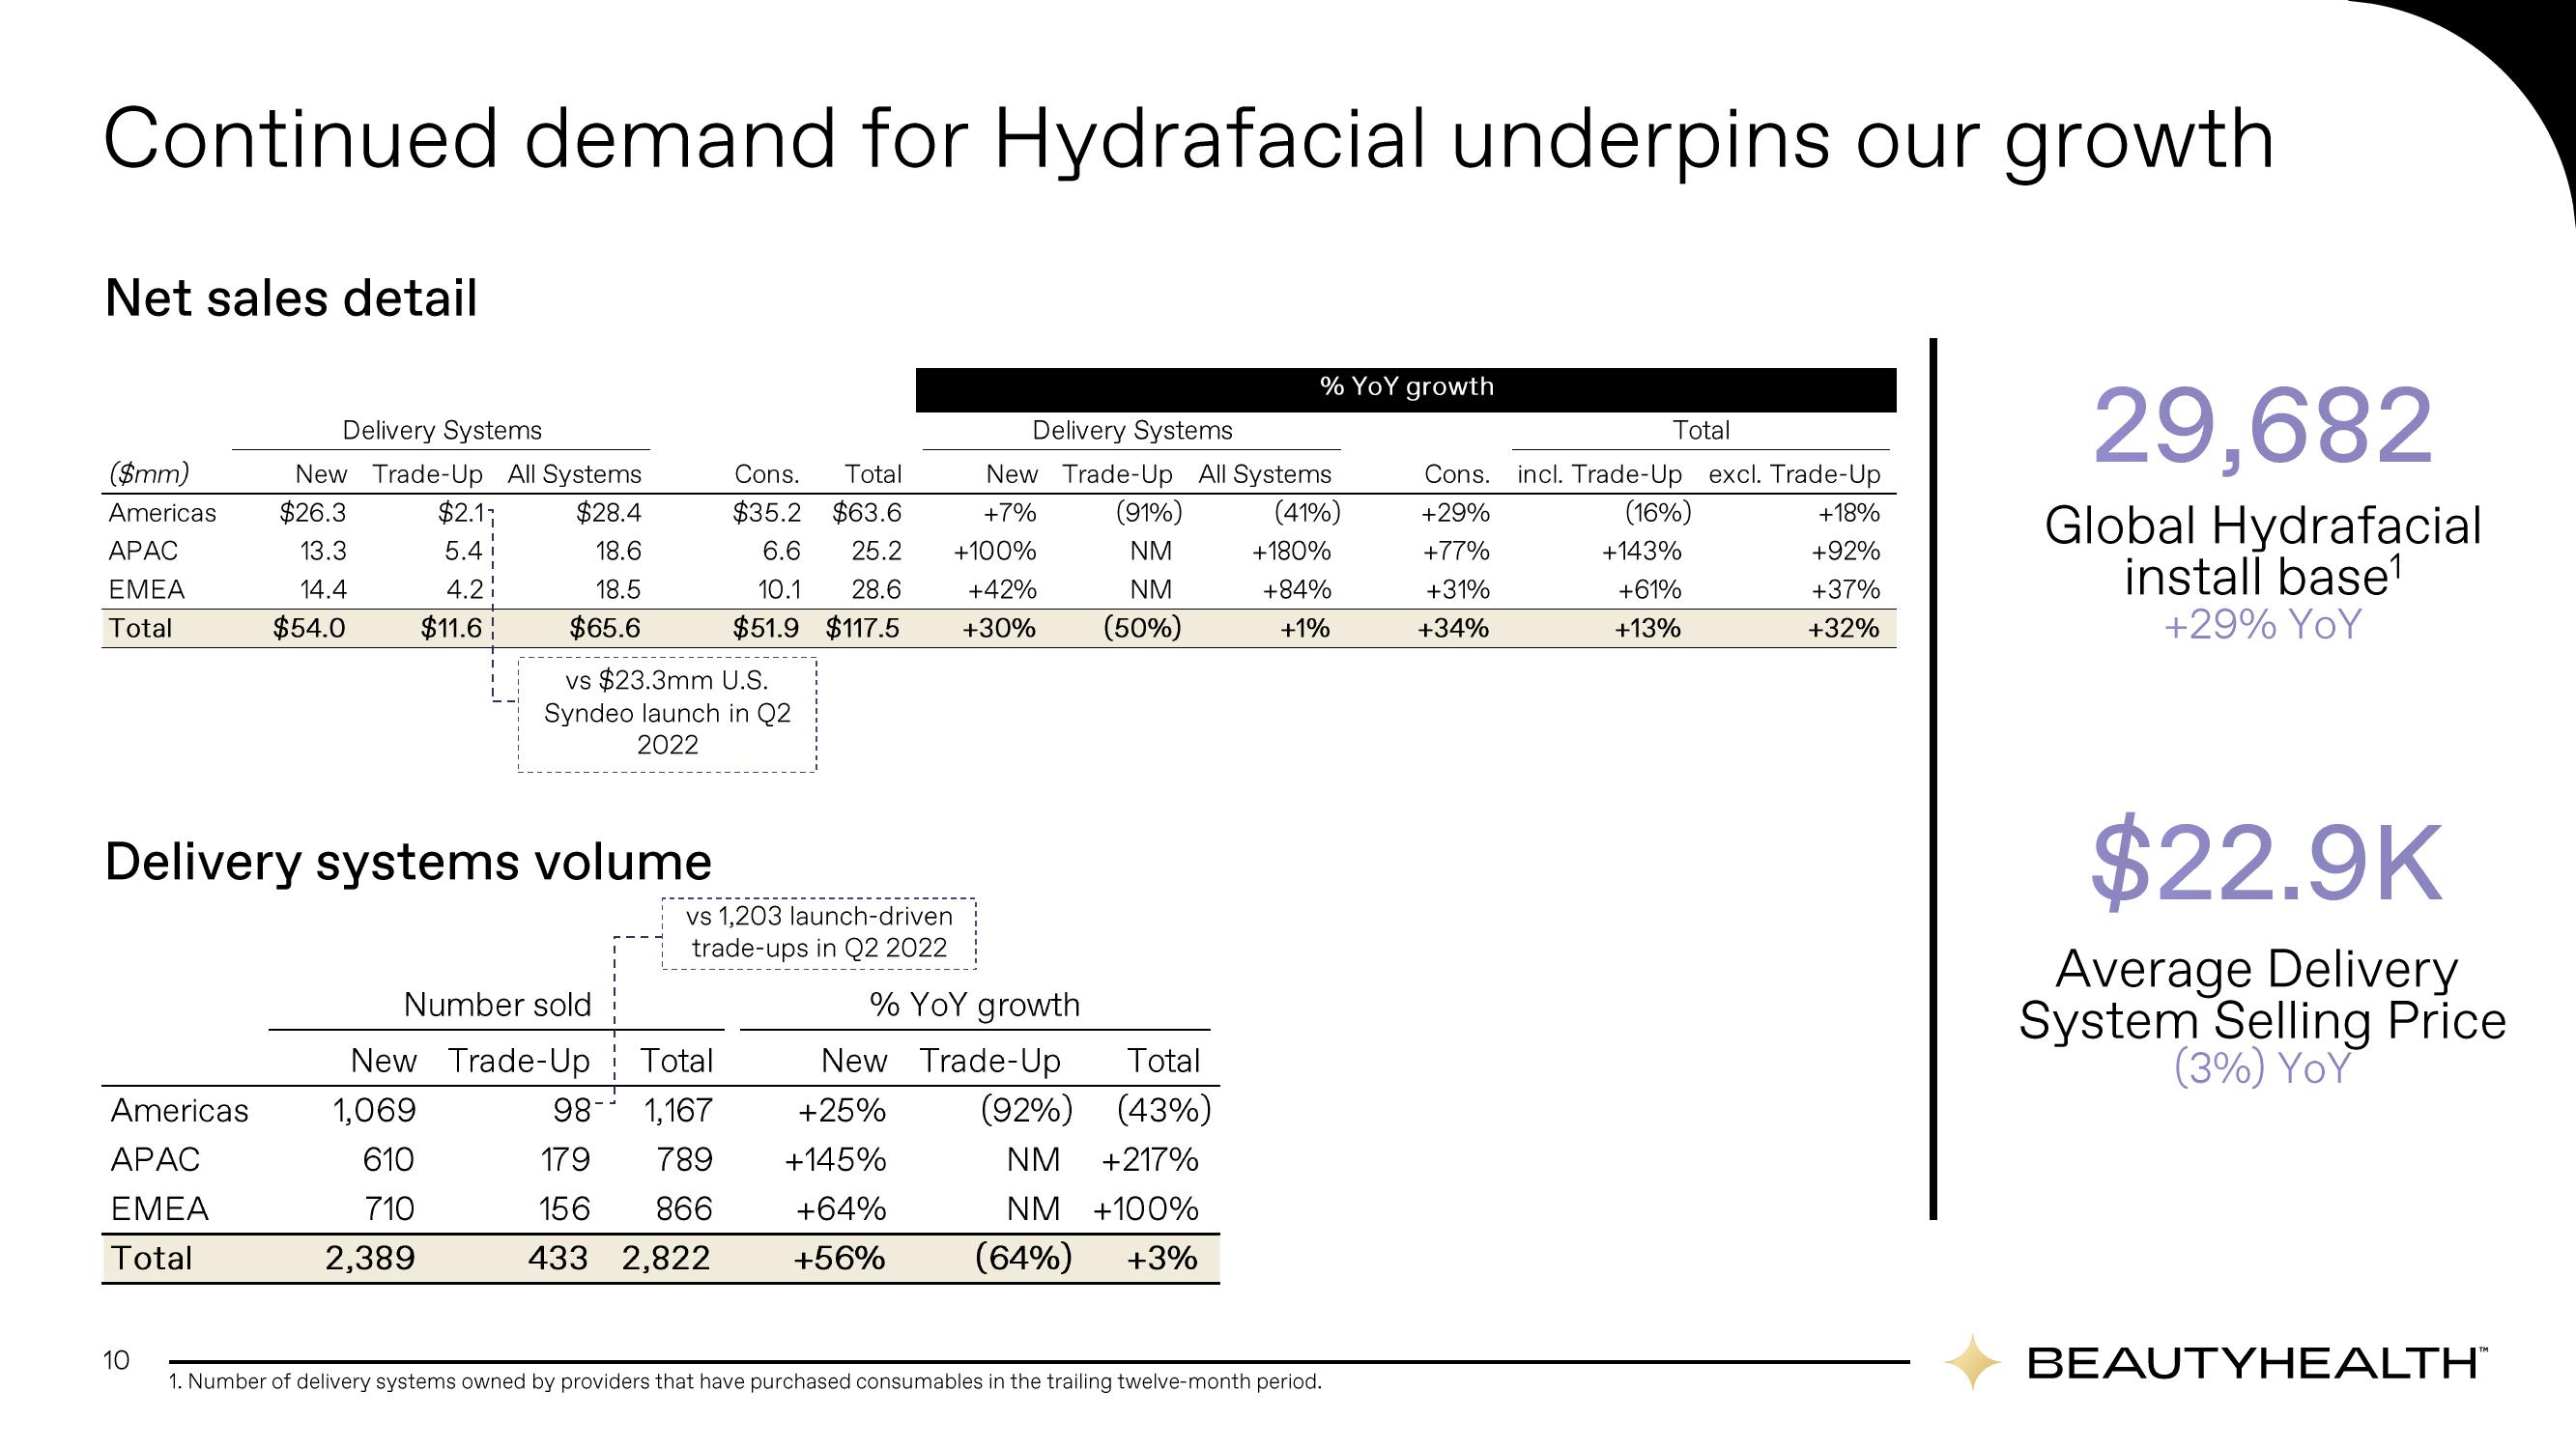
Continued demand for Hydrafacial underpins our growth
Net sales detail
($mm)
Americas
APAC
EMEA
Total
Americas
APAC
EMEA
Total
Delivery Systems
New Trade-Up All Systems
$26.3
$28.4
13.3
18.6
14.4
18.5
$54.0
$65.6
10
$2.1;
5.4
4.21
$11.6
Delivery systems volume
vs $23.3mm U.S.
Syndeo launch in Q2
2022
Number sold
New Trade-Up
1,069
610
710
2,389
Delivery Systems
Cons.
$35.2
Total
New Trade-Up All Systems
$63.6
+7% (91%)
6.6 25.2 +100%
NM
10.1 28.6 +42%
NM
$51.9 $117.5 +30% (50%)
(41%)
+180%
+84%
+1%
vs 1,203 launch-driven
trade-ups in Q2 2022
% YoY growth
New Trade-Up
Total
98- 1,167
+25%
179 789 +145%
156 866
433 2,822
(92%)
Total
(43%)
% YoY growth
+217%
NM
NM +100%
+64%
+56% (64%) +3%
1. Number of delivery systems owned by providers that have purchased consumables in the trailing twelve-month period.
Total
Cons. incl. Trade-Up excl. Trade-Up
+29%
(16%)
+18%
+77%
+143%
+92%
+31%
+61%
+37%
+34%
+13%
+32%
29,682
Global Hydrafacial
install base¹
+29% YoY
$22.9K
Average Delivery
System Selling Price
(3%) YoY
BEAUTYHEALTH™View entire presentation