Bed Bath & Beyond Results Presentation Deck slide image

Bed Bath & Beyond Results Presentation Deck

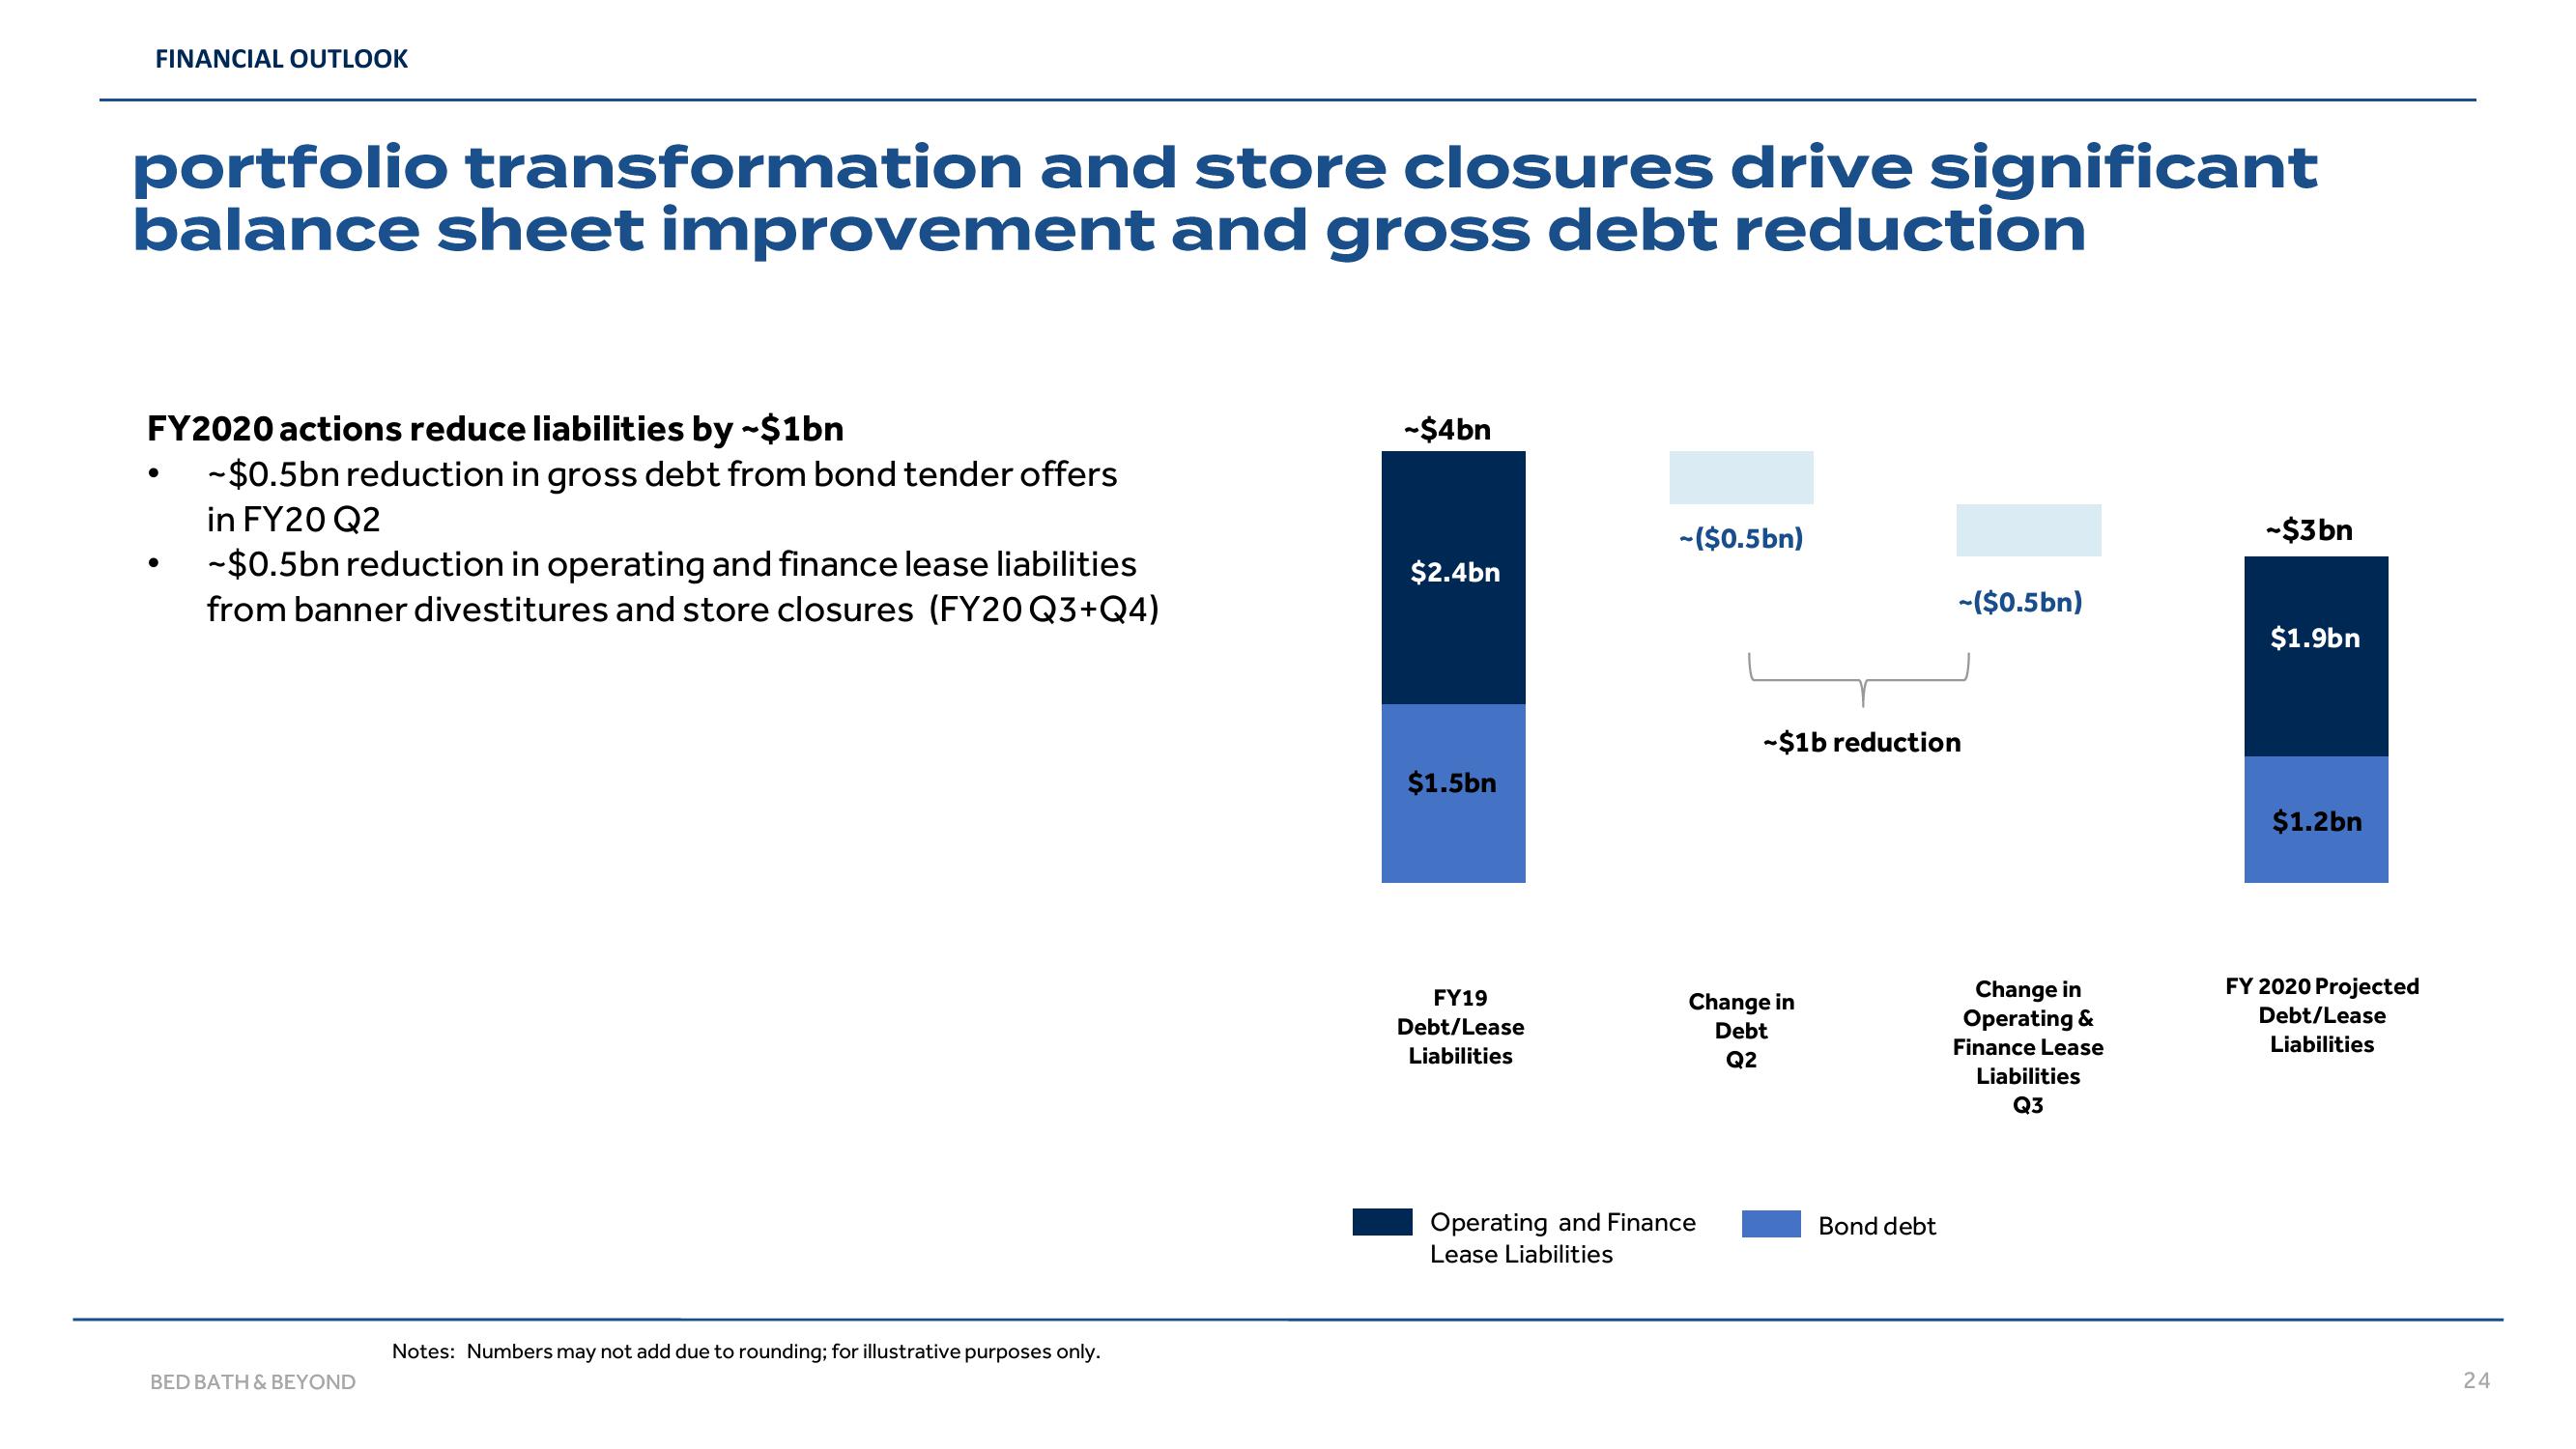
FINANCIAL OUTLOOK portfolio transformation and store closures drive significant balance sheet improvement and gross debt reduction FY2020 actions reduce liabilities by ~$1bn ~$0.5bn reduction in gross debt from bond tender offers in FY20 Q2 ~$0.5bn reduction in operating and finance lease liabilities from banner divestitures and store closures (FY20 Q3+Q4) BED BATH & BEYOND Notes: Numbers may not add due to rounding; for illustrative purposes only. -$4bn $2.4bn $1.5bn FY19 Debt/Lease Liabilities -($0.5bn) Change in Debt Q2 Operating and Finance Lease Liabilities -$1b reduction -($0.5bn) Bond debt Change in Operating & Finance Lease Liabilities Q3 -$3bn $1.9bn $1.2bn FY 2020 Projected Debt/Lease Liabilities 24
View entire presentation