Zegna Results Presentation Deck
●
●
●
FY 2021 CAPEX & TRADE WORKING CAPITALdo Ermenegildo Zegna Group
of
Incidence of TWC back to pre-Covid levels
Investing in Retail, IT and Industrial Platform
70
60
50
40
30
20
10
0
5%
21
39
2019
Capital Expenditure (€ millions)
4%
20
19
2020
Store network Other
% of revenues
4%
22
26
2021*
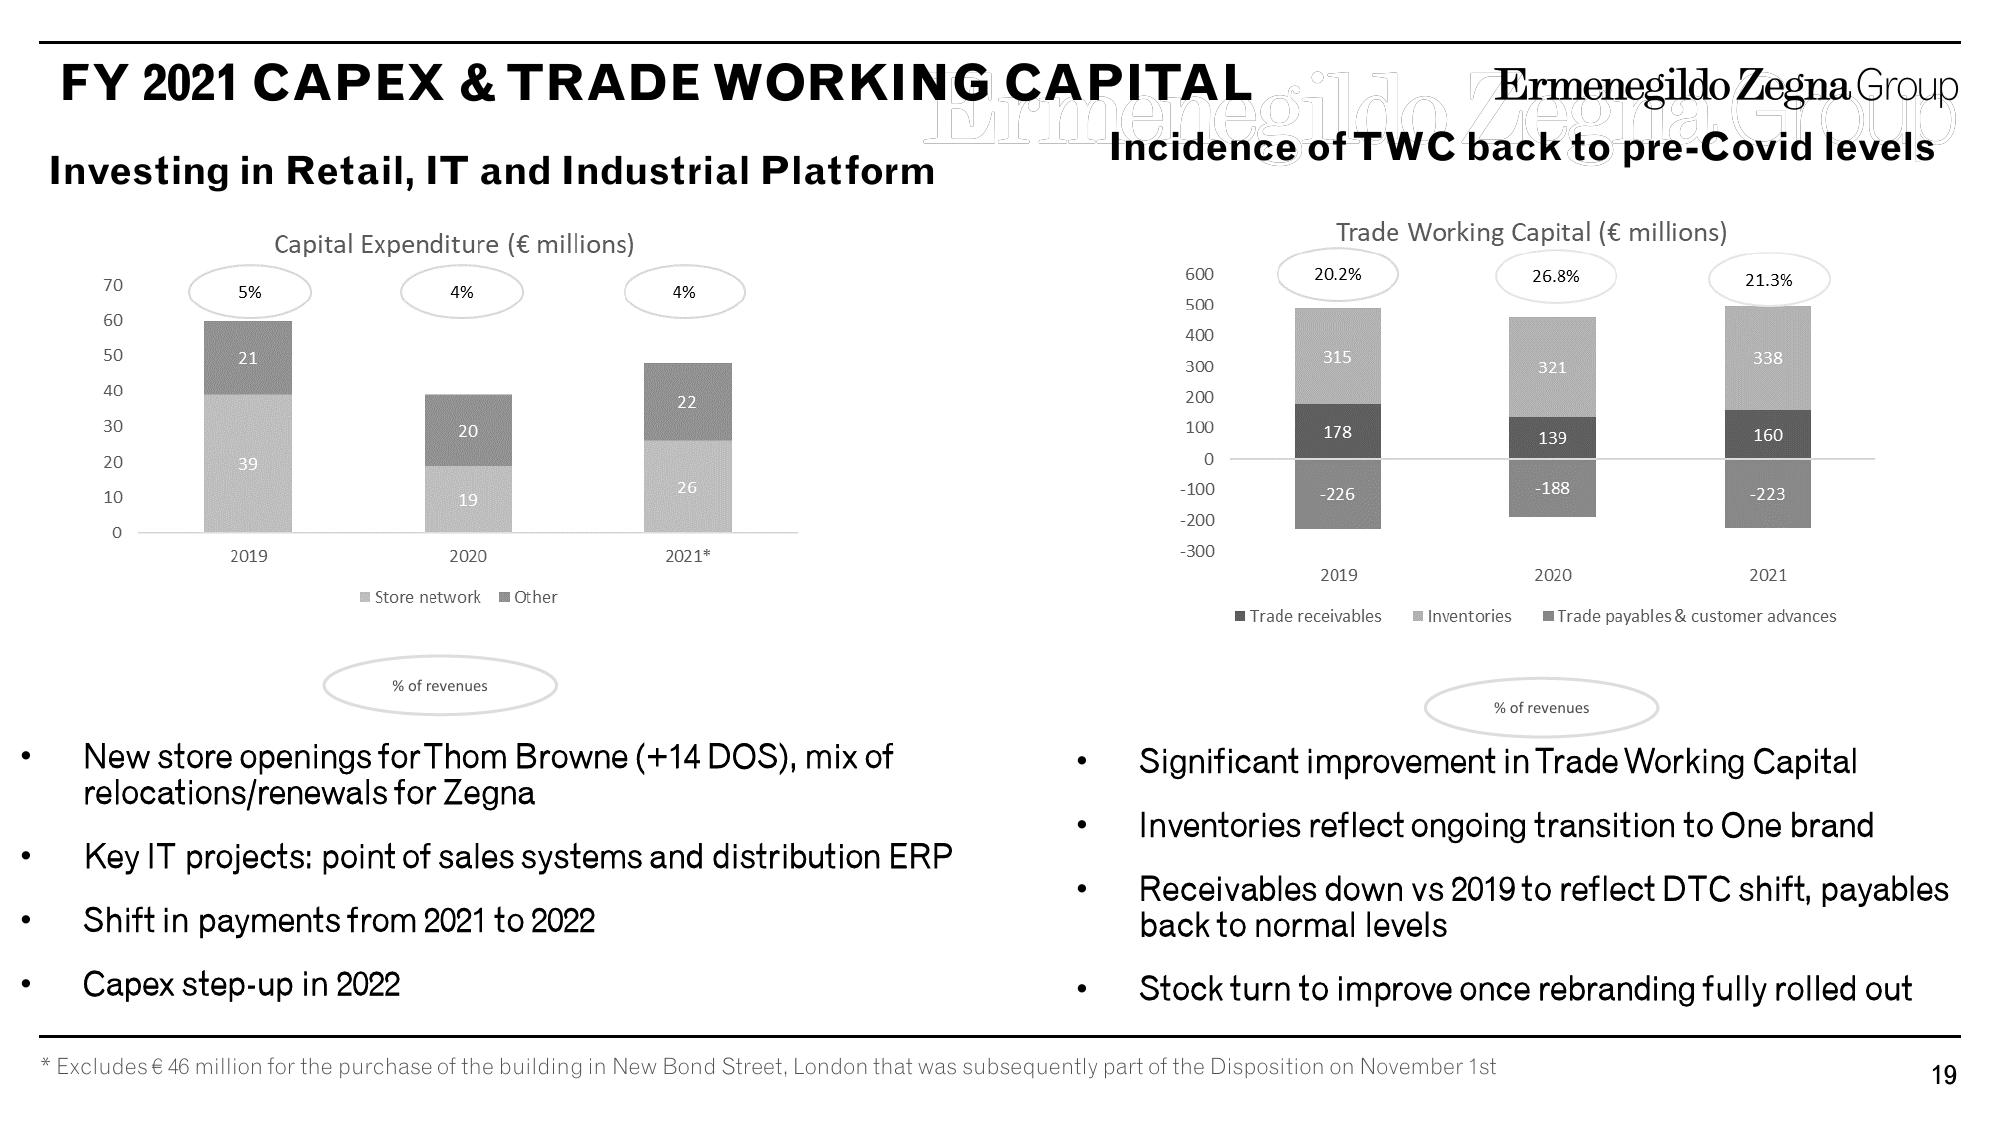
New store openings for Thom Browne (+14 DOS), mix of
relocations/renewals for Zegna
Key IT projects: point of sales systems and distribution ERP
Shift in payments from 2021 to 2022
Capex step-up in 2022
●
●
600
500
400
300
200
100
0
-100
-200
-300
Trade Working Capital (€ millions)
26.8%
20.2%
315
178
-226
2019
Trade receivables
Inventories
321
139
* Excludes € 46 million for the purchase of the building in New Bond Street, London that was subsequently part of the Disposition on November 1st
-188
2020
% of revenues
21.3%
338
160
-223
2021
■Trade payables & customer advances
Significant improvement in Trade Working Capital
Inventories reflect ongoing transition to One brand
Receivables down vs 2019 to reflect DTC shift, payables
back to normal levels
Stock turn to improve once rebranding fully rolled out
19View entire presentation